


Key Insight
The succession wave is ageing, not arriving. Seven annual Census readings show the share of US business owners aged 55 or over moved only from 50.8% to 51.3% between 2017 and 2023, while the over-65 share rose from 20.1% to 23.1%. Those owners are not waiting: about 4 in 10 of those aged 59 or over in 2017 had gone by 2023, roughly 8% a year. And a business that ends usually just ends — on the only public count setting sales against closures, three closed for every one sold. Of more than 36 million US businesses, 92,986 pass every test.
Acquidex Brief · October 2026 · Piece 1 of 5
Everyone agrees a wave of business sales is coming. Seven annual Census readings show no surge building. The share of owners aged 55 or over has barely moved. The share past 65 is creeping up, and older owners are already leaving at about 8% a year. Behind that story sit more than 36 million businesses in the United States. About 200 a year pass every test we set and change hands with SBA financing. And the only public count we know of that sets sales against closures says three businesses have closed for every one that was sold.
The wave everybody is waiting for
The story goes like this. Small businesses in the United States are owned by baby boomers. Those owners are reaching retirement. When they go, millions of businesses will come up for sale, and a generation of buyers will meet a generation of sellers.
It is a good story. It has been told in almost those words for years. A whole advisory industry runs on it. So do a lot of fundraising decks, and most of what gets written about buying a small business. McKinsey, for one, expects six million small businesses to be transitioning over the coming decade.
We went to check the record rather than the forecast. The Census Bureau has published the ages of business owners for every year from 2017 to 2023. That is seven annual readings of the same question, from a survey sent to several hundred thousand employer businesses each year.
In 2017, 50.8% of owners were aged 55 or over. In 2023, 51.3% were.
The share of owners near retirement did not grow. It is the same share, with more of them past 65.
Everyone expects a wave of business sales as owners retire. Seven annual Census readings show no surge building. The share of owners aged 55 or over moved half a point between 2017 and 2023. Same share of owners, more of them past 65.
Not a bigger pool. An older one.
Here is the chart everything else rests on. Seven annual readings of the Census Bureau's survey of people who own a business with employees.
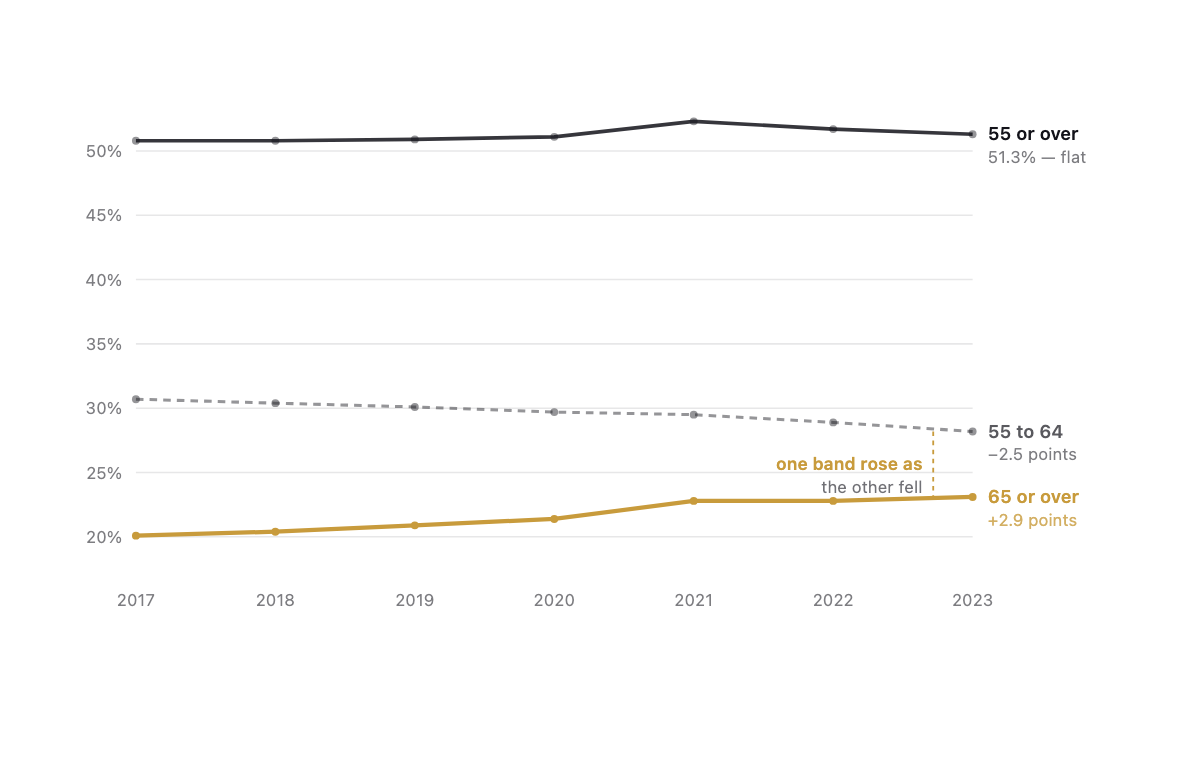
Read the gold line and the dashed line together. The over-65 share rose 2.9 points and the 55-to-64 share fell 2.5. Owners are moving from the younger band into the older one faster than new ones arrive behind them.
Census surveys owners afresh each year rather than tracking individuals, so this is a reading of the bands, not a count of people followed through time. One caution on the size of the rise. Nearly half of it, 1.4 of the 2.9 points, arrives in a single step between 2020 and 2021. That was the year the number of owners the tables cover jumped from 3.52 million to 4.35 million. The over-65 share has not fallen from one reading to the next, so the direction is not in doubt. How big the rise is, is less certain than a smooth line suggests.
Nearly a quarter of owners are now 65 or over. That share has not fallen once in seven readings.
Older owners are already leaving
It would be easy to read that chart as owners refusing to go. The arithmetic says otherwise.
Take every owner who was 59 or over in 2017. By 2023 every one of them had turned 65. If none had left, 38.5% of owners would now be 65 or over. The reading is 23.1%.
Our arithmetic, on two assumptions. Ages are spread evenly across the 55-to-64 band, so 6 in 10 of that band had turned 65 by 2023. And the total number of owners did not change. Make the first 5 in 10 or 7 in 10 and the answer runs from 35% to 45%. A 5% rise in the number of owners would make it 37%. People who became owners after 2017 at 59 or over are left out, which makes the true figure a little higher. A related cut in §03, on long-tenured owners, gives a similar pace.
Is 8% a lot? Between 4.5% and 6% of all owners are new to their business each year, so owners of every age turn over at something like that pace. Older owners leave faster, by somewhere between a third and nearly double.
That has a consequence worth stating plainly, because it is the opposite of the usual picture. There is no dam. Older owners leave at about 8% a year, and slightly more age in behind them than leave. That fits an over-65 share that creeps up by about half a point a year instead of surging. The exits the story is waiting for have been happening through all seven readings.
Owners do stay past 65. If that pace holds, half of today's 65-year-old owners will still own their business at 73. But the leaving is already under way.
The same thing, counted in people
The chart above is percentages. Here are the owners behind them.
How old are they? — owners in the employer firms that answered, 2023 · Census Annual Business Survey, reference year 2023
| Age | Owners | Share of all owners |
|---|---|---|
| Everyone | 4,208,231 | 100% |
| 55 or over | 2,157,838 | 51.3% |
| 65 or over | 970,618 | 23.1% |
Half of the people who own a business with employees are 55 or over. Nearly a quarter are 65 or over.
The survey is a sample. For the 2023 reading Census asked about 330,000 businesses and weighted their answers up. It made no adjustment for the firms that did not answer.
So those counts are not national totals, and Census says so. Its owner tables cover only the firms that answered: 54.6% of the businesses it could classify, in this survey. In its words, the tables "provide percents among owners of responding firms and are not intended to estimate total owners with each characteristic".
The number of owners the tables cover also moves from year to year: 4.73 million in 2017, 3.52 million in 2020, 4.35 million in 2021, 4.21 million in 2023. Owners did not vanish and reappear. Coverage did. Percentages hold up better than counts, because covering fewer owners shrinks the top and the bottom of the fraction together. They are safe only if the owners who drop out resemble the ones who stay. The jump between 2020 and 2021 suggests that is not exactly true.
So this piece leans on the percentages. Wherever it needs a national number, it applies the percentage to the 5.9 million employer firms Census counts. On that basis about 1.4 million businesses have an owner aged 65 or over. That treats one owner as one business, which is rough. The 5.9 million also includes some firms with no individual owner, which makes it a little high. We flag it each time.
And when a business ends, what happens to it?
Census asks owners one more question: "Not including this business, what is the status of the previous business [the owner] started most recently?" About half say this is their first. Of the rest, most still own the earlier one. That leaves the owners whose earlier business is no longer theirs.
What became of the owner's previous business · Census Annual Business Survey, reference year 2023, owners in the firms that answered
| Where it stands now | Owners | Share |
|---|---|---|
| No longer in operation | 355,740 | 58% |
| Bought by another person or company | 118,465 | 19% |
| "Other", which Census does not define | 142,904 | 23% |
| Total | 617,109 | 100% |
Three businesses have closed for every one that was sold. Closing is what normally happens. Selling is the exception.
That ratio sets "Other" aside, and we do not know what "Other" holds. It may include businesses handed on to family or a partner without a sale. If every one of them was a sale, the ratio would be 1.4 to 1. If every one was a closure, 4.2 to 1.
That is the single most important thing in this piece, and it is why the rest of it matters. The question is not whether owners will leave. They will. The question is whether anything is left behind when they do.
The split has barely moved. Between 25% and 27% of the closed-or-sold answers were sales in each reading from 2019 to 2023. That is partly built in. It is a running total, not a yearly rate. Each year's survey describes much the same owners and the same earlier businesses. In 2017 and 2018 the answer choices were different, so the comparable run starts in 2019.
It is also the only public count we know of that sets businesses sold against businesses closed, and it is narrower than we would like. It covers businesses these owners started, not ones they bought. It hears only from people who own a business today. So it contains no final exits: nobody who sold up or shut down and left business for good is in it. And Census asks for the business's "current standing", so one that was sold and later shut by its buyer can be counted as closed. We lean on it because nothing better exists.
The obvious objection: maybe they closed because they were bad businesses
This is the first thing anyone should ask, and it matters more than any other challenge to this piece. If those businesses closed because they were failing, then closing was the right outcome and nothing was lost. There is no stranded inventory. There is just a market clearing out businesses that deserved to go.
We cannot answer it from this data, and we want to be straight about that. Census asks where the business stands. It does not ask whether the business was profitable, and nobody else publishes that either. So we do not know how many of those closures were failures and how many were sound businesses that never found a buyer.
What we can do is a rough check on whether risk explains the pattern. If closure were mainly about failure, owners in the riskiest industries should be the least likely to have sold. Compare two sectors whose SBA loans go bad at almost the same rate:
Same risk, very different outcomes · sold shares from Census ABS, reference year 2023; charge-off rates from SBA 7(a) FOIA, loans approved FY2010–19
| Sector the owner is in now | SBA loans charged off | Sold, of those closed or sold |
|---|---|---|
| Accommodation and food | 7.76% | 32.8% |
| Construction | 7.89% | 15.8% |
"Charged off" means the SBA wrote the loan off as a loss. These are whole-sector rates, on SBA loans of every purpose. Inside accommodation and food, restaurants run at 8.5–9.4% and hotels at 2.4%, which is why the sector average lands below its biggest component. The fourth piece in this series works at that finer level. Census files each answer under the industry the owner is in now, not the industry of the business that ended. Owners often stay in their trade, but not always, so read the sector as a strong hint rather than a measurement.
Those two sectors have the same charge-off rate. Owners in one were twice as likely to have sold their previous business as owners in the other. So at sector level, risk does not line up with who sells. That says nothing about any single business, and we picked this pair because it is striking.
There is an obvious suspect, and §04 comes back to it. On our screen, about a quarter of construction firms are in trades where an owner or a named licence-holder on staff must hold the licence. No accommodation or food business is. That could explain at most half of the gap. One pair of sectors is not a test. But it is the direction you would expect if a licence gets in the way of a sale.
Take the 15 sectors where at least 3,000 owners report a previous business that ended. Risk and the odds of selling are essentially unrelated: −0.09, on a scale where 0 means no connection. That test is weak. 15 sectors is a small sample. Treat it as a reason to doubt the failure story, not as a refutation of it.
On the wording: Census's instructions say the question asks for the "current standing" of the previous business the owner "established but did not purchase". Source: Census Bureau, Annual Business Survey instructions, Section B, Prior Business Ownership.
Even the forecasters expect most of these businesses to close. McKinsey counts around one million of its six million as "viable candidates for sale". It warns that without enough qualified buyers, "up to 92 percent of viable businesses" could close rather than sell. Its own word for them: "perfectly healthy businesses." Its estimate of the record is starker than the Census count. Of 510,000 exits in 2022, it puts 92% as closures, 5% as sales and 3% as transfers. One caution. Those are a model's estimates, not a count. Source: McKinsey Institute for Economic Mobility, "The Great Ownership Transfer", 2026; The McKinsey Podcast, 14 May 2026.
The share of owners near retirement is not growing. Its mix is getting older: the share aged 65 or over rose from 20.1% to 23.1% while the 55-to-64 share fell. Older owners are already leaving, at about 8% a year. And on the only public count, three businesses have closed for every one that was sold.
More than ten owners leave for every SBA-financed sale
The band arithmetic above is an inference. There is a more direct way to watch owners leave. Census asks owners what year they acquired their business, which lets us follow one fixed group as it drains.
In 2017, 29.2% of owners said they had acquired their business before 2000. By 2023 it was 17.9%. The share fell in every one of the six years, by between 3% and 10% of itself. That group is losing about 8% of itself every year, close to the pace the age bands gave.
Averaged over those six years, that is 1.9 points of all owners a year. Applied to the 5.9 million employer firms Census counts, it is about 110,000 businesses a year losing a long-tenured owner. The group is smaller now, so today's figure is nearer 82,000.
Over the six fiscal years 2020 to 2025, the SBA approved financing for 5,638 business acquisitions a year, for sellers of every age. An SBA fiscal year runs from 1 October to 30 September.
For every business sold with SBA financing, more than ten lose a long-tenured owner. But the SBA is not the whole market.
On the six-year averages it is about 20 to 1. At the group's size today it is about 15 to 1, and 12 to 1 against the SBA's best year. On the survey's own totals, which leave out the firms that did not answer, the same sums give between 8 and 14 to 1. All of these treat one owner as one business, so a firm with two long-standing partners counts twice.
Is the SBA's own count rising?
It is, and we would rather show it than have it found.
Business acquisitions the SBA approved financing for, by fiscal year · SBA 7(a) and 504 FOIA, change-of-ownership loans, cancelled loans excluded
| Fiscal year | Acquisitions |
|---|---|
| 2019 | 5,685 |
| 2020 | 5,062 |
| 2021 | 6,185 |
| 2022 | 4,808 |
| 2023 | 4,876 |
| 2024 | 5,782 |
| 2025 | 7,112 |
The count dipped in fiscal 2022 and 2023 and has climbed since. Fiscal 2025, at 7,112, was 15% above the previous high in 2021. The first nine months of fiscal 2026 show 4,420 under 7(a), against 5,048 in the same months a year earlier. The file records no approvals at all in October 2025, when the federal government was shut down, so the monthly pace is about the same.
Is that the wave arriving? We do not think the data can say yet. All SBA lending grew over the same years. Loans of every kind under 7(a) rose 52% between fiscal 2022 and 2025, from 42,282 to 64,096. Acquisitions under 7(a) rose 49%. As a share of 7(a) loans, acquisitions were 13.6% in fiscal 2020 and fell to 8.9% in 2024. They were 10.7% in 2025 and 12.4% in the first nine months of 2026. That is a recovery toward where the share started, not yet a break above it. Two strong years follow two weak ones. And the whole rise since 2023 is about 2,200 loans a year, against something like 82,000 to 110,000 businesses a year losing a long-tenured owner. If the share climbs past its 2020 level, it will be the first sign of a wave in transaction data. §09 lists it among the things that would change our mind.
How much of the market does the SBA actually see?
This matters, and it is the fairest challenge to everything in this piece. Every transaction count here comes from SBA loan files. Businesses also change hands on seller notes, private credit, conventional bank debt and plain cash, and none of that appears in our data.
Nobody counts those sales. But the same Census survey gives three rough ways to size them.
How many businesses are sold in a year? Three rough cuts · Census Annual Business Survey shares, reference years 2017 and 2023, applied to 5.9 million employer firms; SBA 7(a) and 504 FOIA, FY2020–25 average
| Cut | The arithmetic | Sales a year | SBA's 5,638 as a share |
|---|---|---|---|
| Buyers | 4.5% of owners a year are new to their business. 22% of owners bought theirs. | 58,700 | 10% |
| Sellers, counting "Other" as not sold | If 4.5% arrive each year, about 4.5% leave. 19% of previous businesses were sold. | 51,100 | 11% |
| Sellers, setting "Other" aside | The same 4.5%. 25% of previous businesses were sold. | 66,500 | 8% |
Two different questions point the same way. 22% of owners bought their business. Between 19% and 25% of previous businesses were sold. Either way, between 51,000 and 66,000 employer businesses are sold in the United States in a year, and the SBA finances about a tenth of them.
All three cuts lean on one survey and on assumptions we cannot test. The 4.5% is the average share of owners in the 2023 reading who acquired their business in 2020, 2021 or 2022: 181,800, 207,606 and 181,013 of 4,214,749. Owners who came and went inside those years are missed, and earlier years ran at 5% to 6%. Both would make the SBA's share smaller. The 22% is the share of all owners in 2017 who said they bought their business, applied here to new arrivals. 69% founded theirs and the rest inherited it or were given it. "Bought" includes buying a share from a partner. The SBA's count includes partner buyouts too, and treats one loan as one sale. Every cut treats one owner as one business. Against fiscal 2025 alone, the SBA's 7,112 is 11% to 14%. McKinsey's model gives a lower count than any of these: 510,000 exits in 2022, 5% of them sales, or about 25,500. On that figure the SBA's share would be nearer a fifth.
So the honest gap is not ten or twenty owners leaving for every sale. That counts only the sales the SBA finances. Count every route and the Census counts apply: three businesses have closed for every one that was sold.
That is still a wide gap. But it is a very different claim. Anyone quoting the SBA numbers as the whole market — us included, until now — overstates the gap about ten times over.
Now the honesty about the first ratio, because it is the most quotable number here and the one to trust least. A fixed "before 2000" group shrinks for several reasons at once. Owners retire. Owners die. Businesses close. Businesses shed their last employee and drop out of the survey. And the survey has sampling error.
So this is not a count of retirements. It is the rate at which long-tenured owners stop appearing in the data, for all reasons together. Read it as an order of magnitude. On every like-for-like basis, more than ten owners leave for every SBA-financed sale.
Three SBA totals appear in this piece. 5,638 a year is the six-year average across both programmes. 7,112 is fiscal 2025 alone. 5,446 a year is the six-year average for 7(a) alone, which is the programme the state, county and metro rates are built on.
A cleaner ratio
There is a second comparison with fewer moving parts, and it is starker.
Census counts new business applications that indicate planned wages — filings of intent, not guaranteed launches. Over the six fiscal years 2020 to 2025 those ran at 567,265 a year. Over the same six years the SBA financed 5,638 business acquisitions a year.
For every SBA-financed purchase of a business, 100 applications are filed to start a new one with planned wages. Count purchases by every route and it is still about 10.
Both are counts from administrative records, over the same six fiscal years. A filing is intent, not a launch, and a purchase here is an approved loan. We cannot count the people who set out to buy and did not.
More than ten long-tenured owners leave for every business sold with SBA financing. On our best reading the SBA finances about a tenth of business sales. Count every route and the Census counts give three closures for every sale. SBA-financed sales have risen since 2023, and we cannot yet say whether that is a wave or a recovery. And 100 applications to start a business with planned wages are filed for every SBA-financed purchase of one.
What is actually out there
Before going further, the denominator has to be fixed, because almost every version of this story gets it wrong. Here is the whole market in one figure.
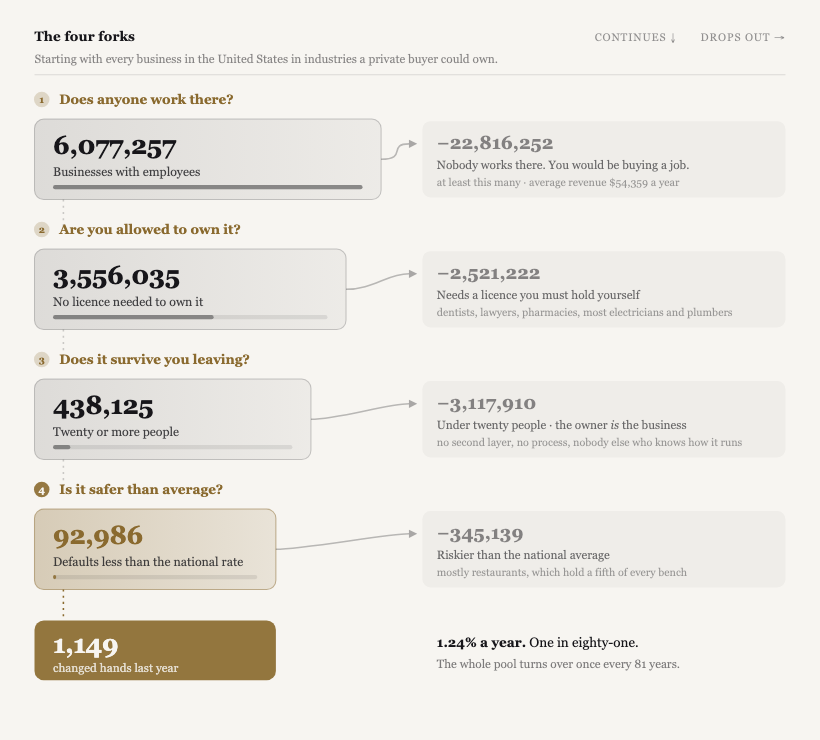
Take the forks one at a time, because each one answers a different question a buyer actually asks.
Fork one: is it a business, or a job?
30,427,808 businesses in the United States have no employees at all, against 6,294,604 that do. That is 83% of every business in the United States. Their average revenue: $57,611 a year.
That number tells you what kind of business this is. $57,611 a year, and nobody on the payroll. That is a job somebody pays themselves to do. A buyer would be purchasing that person's own labour and a list of customers, and the person is what is for sale.
When somebody says millions of businesses are about to come to market, ask whether their number counts people who have no employees. If it runs to tens of millions, it does. Only about 6 million businesses in the United States employ anyone.
The extremes make it concrete. Taxi and limousine services are 99.5% nonemployer at $30,506 a year — that is a driver, not an asset. Independent artists, writers and performers are 96.8%. Pet care is 86.9%. At the other end, full-service restaurants are only 22.0% nonemployer, because a restaurant is hard to run alone. Where the work genuinely needs a team, the business is a real business.
Fork two: does a licence get in the way?
2,521,222 of those firms do not get past the second fork. They are three different groups, and only the first puts a licence between a buyer and the business.
- 1,601,343 are in industries built around a licensed profession or trade. There the licence generally has to be held by an owner, or by a named qualifier the business employs. In most states you cannot own a dental practice outright unless you are a dentist. Much the same holds for medical practices and law firms, and in many states for electrical and plumbing contractors. The workarounds that exist — management companies, hired qualifiers — are open to institutions far more readily than to individual buyers.
- 481,079 are in industries where the staff or the premises are licensed and the owner need not be. Trucking, home health care, child care, fuel stations. A buyer can own these.
- 438,800 we could not classify. Seven in ten are shops and online retailers. Census re-coded its retail industries in 2022, and our licence table and our firm counts sit on opposite sides of that change. Most of the rest are schools and training providers, which the licence table does not cover.
We set the second group aside by choice, to keep the screen strict. The third is a gap in our own matching that we have not closed. Either way, everything left is an industry with no licensed profession or trade at its core, and every count from here down is lower than it need be. As many as 4.5 million of the 6.1 million could in principle be owned by anyone.
The screen is ours. It flags an industry when a licensed occupation passes two tests. It makes up at least 5% of the industry's jobs. And it is at least five times as concentrated there as in the economy as a whole. It looks at professional and trade licences. It does not look at ordinary business permits, such as a liquor licence or a health inspection. The third piece in this series documents it.
That leaves 3,556,035, or 58.5%. The industries that need a licensed owner hold 26% of the firms but only 14% of the jobs, because they are numerous and small. The third piece is about nothing but this wall, and what it is worth to the people behind it.
Fork three: does it survive you?
This fork removes the largest share of what reaches it: 88%. 3,087,873 of the firms that clear fork two have fewer than 20 people. At that size the owner is the business — the salesperson, the estimator, the relationship, and often the person doing the work. We also drop 25,898 rows for firms with 1,000 or more people, which nobody would call a small business, and 4,139 that Census does not size.
That leaves 438,125 with a real bench: 20 to 999 people, which is 12.3% of what clears fork two. Twenty is our line and it is arguable: ten would leave 815,603 and fifty would leave 174,050. The shape does not change with the threshold, only the headline.
Is twenty the right line? Not exactly.
We should test our own filter rather than defend it. So we checked whether twenty employees is a real boundary or a convenient one.
Charge-off rate by size of business · SBA 7(a) FOIA: charge-offs on seasoned FY2010–19 loans; median loan on FY2020–25 acquisitions
| Jobs the lender reports | Loans | Charge-off rate | Median acquisition loan |
|---|---|---|---|
| 1–4 | 164,236 | 7.74% | $482,500 |
| 5–9 | 94,441 | 7.40% | $575,000 |
| 10–19 | 74,245 | 6.80% | $790,000 |
| 20–49 | 52,020 | 6.44% | $1,110,000 |
| 50–99 | 13,508 | 5.51% | $1,380,000 |
| 100+ | 5,230 | 5.09% | $2,115,000 |
| None reported | 75,327 | 6.68% | $500,200 |
Business size in the loan file is the SBA's jobs-supported figure: jobs created plus jobs retained, as the lender reports them. The SBA's own data dictionary says it "does not review, audit, or validate these numbers". One seasoned loan in six reports no jobs at all; those sit on their own row rather than being counted as the smallest businesses.
There is no cliff at twenty. Risk falls steadily as businesses get bigger, from 7.74% at the smallest to 5.09% at the largest. The biggest single step is between 20–49 and 50–99, above our line, not at it.
So twenty is a judgement call about organisation, not a number the data handed us. Below twenty people, in our judgement, a business rarely has a second layer of supervision. That is reasoning rather than measurement.
Move the line to ten and the pool nearly doubles to 815,603. Move it to fifty and it falls to 174,050. The number changes. The shape of the argument does not.
And what size of business are we talking about, in money?
A fair question, because nothing above mentions a price. Census counts firms and employees; it does not publish what they are worth. So the inventory in this piece has no price filter on it at all.
What we can say is what businesses of this size borrow when they do sell.
A rough guide only. The loan covers 90% of the price when the buyer puts in the minimum 10%. Buyers often put in more, and some loans also cover property or working capital. Larger businesses borrow more: the median loan is $1.38m at 50 to 99 jobs and $2.1m at 100 or more.
And one number that should temper everything here. Only 19.5% of SBA-financed acquisitions report 20 or more jobs. 78% report fewer, and 3% report none.
That cuts both ways, and we would rather say so. Our 92,986 is a quality screen, not a description of the market. It selects for businesses bigger than four fifths of what the SBA finances. A buyer working at $400,000 is shopping in a different market from the one this piece describes, and that market is far larger and somewhat riskier.
Fork four: is it in a large, safer-than-average industry?
The last filter is risk. We measure it on 479,007 SBA 7(a) loans approved in fiscal years 2010 to 2019, old enough to have gone bad if they were going to. "Default" here means the SBA charged the loan off. An industry stays in only if it clears two bars. Its loans must be charged off less often than the file's all-industry rate of 7.13%. And it must hold at least 1,000 firms of this size, because nobody can run a search in an industry of 40.
Those are SBA loans of every purpose, not only loans to buy a business. And 82% of the ones that report a size went to businesses with fewer than 20 jobs. So this test ranks industries. It does not rate the larger businesses inside them.
34 industries clear both bars. They hold 92,986 businesses. We call them the turnkey set, or the good set. Both are shorthand for passing our screen, not a verdict on any one business. The five largest are services for the elderly and disabled, hotels and motels, landscaping, temporary staffing and custom software. The fourth piece in this series lists all 34.
Not all 34 are safer by the same margin. For 18 of them, holding 53,552 businesses, the gap to the average is bigger than chance could produce. The other 16 sit below the line but close to it, and may simply be average. Hotels are the clearest case, at 2.4% on 7,706 loans.
The 345,139 that drop out are three different groups, and only the first is a verdict.
- 208,716 are in industries whose loans go bad more often than average. Restaurants and snack bars are the biggest block: 92,218 firms, which is 44% of this group. For 51 of these 99 industries, holding three quarters of the firms, the gap is beyond chance.
- 115,785 are in industries the loan file cannot rate, because it holds fewer than 300 seasoned loans in each, or because the SBA does not lend to them. They are not safe or unsafe. They are unmeasured.
- 20,638 are in 42 industries whose loans go bad less often than average but which are too small to rank. Drop the size bar and 76 industries pass, holding 113,624 businesses.
92,986 businesses survive all four questions — about 1,800 per state. That is everything that clears every bar we set, not everything worth owning.
That is 1.5% of the businesses with employees. And the honest caveat that travels with it: the risk test can only rate 175 industries, covering 322,340 of the 438,125 firms. Two fifths of what this fork removes is unmeasured or simply small, not risky.
One more thing about every count in this section. Census counts a firm once in each industry it operates in. For firms with fewer than 20 staff that changes nothing. For firms with 20 to 999 staff it adds 11% across the United States, and 47% for those with 100 to 999. Allowing for that, the 92,986 is nearer 84,000 separate firms, and 1 in 395 is nearer 1 in 440. We keep Census's count, because the overlap cannot be taken out industry by industry.
So we cannot say which way 92,986 errs. The strict licence screen, the pandemic-year count and the unrated industries make it too low. Firms counted in more than one industry, and nonprofits, make it too high.
Of 6,077,257 businesses with employees, three questions remove almost all of them. One is a licence question: 64% of what it removes sits behind an owner's licence, and the rest we set aside or could not classify. One is too few staff to survive you. One is an industry that is risky, unrated or too small to rank. 92,986 remain. That is a screen, not a census. Twenty employees is our judgement call, not a cliff in the data. The filter has no price on it, though SBA loans on the smaller of these businesses imply prices of about $1.2m.
How many change hands
92,986 businesses pass every filter. That is the stock. The question that decides whether a buyer ever finds one is the flow.
In a typical year the SBA finances about 1,140 acquisitions in those 34 industries. But most of them are small. Only about 204 a year are businesses the lender records as supporting 20 or more jobs, which is the size our third fork demands. That is 196 under 7(a) and 8 under 504.
204 of the 92,986 change hands with SBA financing in a year. That is 1 in 457.
The SBA figure understates the real turnover, and for this group by more than usual. The 7(a) programme lends at most $5 million, and 1 in 10 of the 7(a) loans among these 204 is already at that cap. A fifth of the 92,986 belong to firms with 100 or more staff, yet only 14 of the 204 are businesses with 100 or more jobs. The larger ones either sell some other way, where we cannot see them, or do not sell at all.
Is 1 in 457 low? Against what a buyer hopes for, yes. Against other businesses, no. Take every industry that clears the licence fork and that the SBA will lend to, at every size. 1 business in 942 changes hands with SBA financing in a year. Among those with 20 or more staff it is 1 in 567. The good ones sell a little more often than others their size. It is still almost never.
We count loans approved and not since cancelled, and one loan as one sale. Nobody publishes how many businesses are offered for sale and fail to sell, so nothing here measures what is on the market. The 204 is 1,221 sales in six years, or 203.5 a year, and 1 in 457 is worked from that. On separate firms rather than Census's industry-by-industry rows (§04), it is nearer 1 in 410.
Two things fall out of that and both are uncomfortable.
First, almost everything the SBA finances is outside the good set. Of about 5,640 acquisitions a year, about 1,140 are in the 34 industries, and only 204 of those are big enough to pass our third fork. That is under 4% of what the SBA finances. This is not buyers choosing badly. Four in five acquisitions are in other industries. And more than four in five of the rest do not report 20 jobs, because most businesses are small.
Second, the scarcity here is not a scarcity of businesses. There are 92,986 of them. It is a scarcity of businesses changing hands, which is a different problem.
If you have spent two years looking and found nothing worth owning, this is the arithmetic behind that experience. You are not searching badly. The inventory you want exists, and almost none of it changes hands in any given year.
About 204 of the 92,986 sell with SBA financing in a year. That is 1 in 457, and perhaps 1 in 45 counting every route. It is a little faster than other businesses of the same size, and still almost never. Under 4% of what the SBA finances is in the good set: most of it is in other industries, and most of the rest is small.
Why some places sell and others do not
Everything so far is about how few of these businesses change hands. This section asks something narrower: why the rate differs so much from place to place. We have not explained the low level itself, and we cannot close the narrower question either.
Start with the two ends. Across the five boroughs of New York City there are 120,421 business locations in industries with no licensed profession at their core and nothing to stop the SBA lending. Call those in scope. In the six fiscal years 2020 to 2025, 102 of them changed hands with SBA financing. Marinette County, Wisconsin, has 564 such locations and 17 changed hands over the same six years — 36 times the rate.
Neither end is typical. Marinette is the fastest of 1,253 counties with at least 400 such locations, and 17 deals is a small number. New York City sits at the other extreme. Of the 182 counties with at least 5,000 such locations, only one outside the city sells less often than the city does: Hidalgo County, Texas.
Census counts these as locations, so each branch of a chain counts once, and they are locations of every size. It also withholds any county-and-industry cell with fewer than 3 establishments, which undercounts small counties; we put those back from the industry-group totals. Without that step Marinette would show 425 locations and a rate 47 times New York City's. The 102 and the 17 count both SBA programmes. Both rankings above hold on 7(a) alone as well. We cannot check whether New York's sales lean more on other financing than the rest of the United States.
How big is the spread, once chance is taken out?
Smaller than the two ends suggest. Small counties have few sales, and small numbers bounce. Among the 1,253 counties, a fast one that outsells 9 in 10 sells 6.5 times as often as a slow one that outsells only 1 in 10. But if every county sold at exactly the same rate, chance alone would still produce a gap of 3.5 times.
So look where the numbers are big. Among the 40 metro areas with at least 20,000 such locations, a fast one sells 2.3 times as often as a slow one. Chance would give 1.2. The two ends of that list are Minneapolis–St Paul and the New York metro area, 5.6 times apart.
We examined 13 explanations for that spread. None of them explains it.
Six of the 13, and what each came back as · all tested on SBA 7(a) FOIA sale rates, FY2020–25; the fifth piece carries every test
| Explanation | Result |
|---|---|
| Credit is harder to get in slow markets | cannot be tested: we see only loans that were made, on the same terms everywhere |
| Local lenders are missing from slow markets | a faint link: fast states use slightly more local lenders |
| High prices mean more buyers competing | bigger loans go with slower markets, which fits competition or its opposite |
| Older owners mean more sales | the opposite: states with older owners sell less |
| Industry mix differs by market | explains under 1% of it |
| Too many buyers chasing too little | three indirect tests, nothing in any |
We could not test buyer competition directly. Nobody publishes how many buyers are looking, or how many businesses are on offer. We have no sale prices either, so we used the next best thing: the size of each SBA loan against the national median for the same industry. Across the 61 metros with at least 60 deals, places where loans run larger sell less often. That could mean buyers bidding up a short supply. It could mean bigger, costlier businesses are harder to sell. The loan data cannot tell those apart.
One of the 13 looked like more than a faint link, and it did not survive a check. Brokers publish lists of 15 states that require a licence to sell a business. Metros in those states sell 1.19 times as often as metros elsewhere, and the states themselves 1.28 times.
Then we read the 15 state laws. By our reading, 7 require a licence to sell a business as such. The other 8 require one only where real estate or a lease is part of the deal. Set each group against every other state, and the gap is the same: 1.25 times for the 7 and 1.24 times for the 8. So whatever sets those states apart, it is not the licence. On the 7 alone the odds of the gap arising by chance are about 1 in 10. With 13 explanations examined, that is no result at all.
What the 15 do share is more brokerage. They have a median of 44 brokerage offices per 1,000 in-scope locations, against 31 elsewhere. That points where the next section goes: at the presence of an intermediary, somebody whose job is to introduce the two sides.
Others showed faint links. States where more of the lending is local, and places with fewer non-citizen owners, sell slightly more with SBA financing. Nothing comes close to explaining the gap.
The 7 are Arizona, California, Florida, Minnesota, Rhode Island, South Dakota and Wisconsin. The 8 are Colorado, Georgia, Idaho, Nebraska, Nevada, Oregon, Utah and Wyoming. We read each state's licence law or its regulator's rule on 5 October 2026, six of them from archived copies of the official pages. Arizona's wording is arguable. Oregon's and Wyoming's laws do not mention business sales, so we read them as covering only the real estate in a deal. We did not check the 36 states on no list. The metro comparison is 80 metros in the 15 states against 138 elsewhere, single-state metros only.
Among large metro areas, a fast market sells 2.3 times as often as a slow one. The two ends, Minneapolis and New York, are 5.6 times apart. We examined 13 explanations for that. None explains it. It is not industry mix, and older owners go with fewer sales, not more. We could not test credit or buyer competition directly.
Is the layer in the middle too thin?
If none of that explains it, the next place to look is the machinery in between. The brokers, the advisers, the lenders, the accountants who have to touch a business before it can change hands.
Here is what can be measured of it.
In the median state, two thirds of 7(a) acquisition loans come from a lender based somewhere else. The capacity to finance these deals is not spread evenly. Ten lenders write 30% of the loans, and fifty write more than half.
To be clear about what is and is not scarce: the dollars are not. They travel anywhere. Whether the people who underwrite them are scarce is something we cannot measure.
The broker side is harder to see, so we went and measured it.
Census publishes county-level establishment counts by industry — the County Business Patterns series, 2023 vintage. One of those industries is offices of real estate agents and brokers. We know of no public count of business brokers. Where a state does license the sale of a business, the licence is a real estate one, so this is the nearest public measure. It is a rough proxy. It measures real estate brokerage, not business brokerage.
We built brokerages per 1,000 in-scope business locations for every state, and for the 1,243 counties big enough to measure. Then we tested it against how often businesses change hands with SBA financing.
Brokerage density against sale rate · nine of the 51, chosen to show the range and the exceptions discussed below · brokerages from Census County Business Patterns 2023, NAICS 531210; sales from SBA 7(a) FOIA FY2020–25
| State | Brokerages per 1,000 locations | Sales per 1,000 locations a year |
|---|---|---|
| Colorado | 80.7 | 1.59 |
| Arizona | 79.8 | 0.94 |
| Florida | 65.7 | 0.74 |
| Minnesota | 39.2 | 1.62 |
| Wisconsin | 26.6 | 1.47 |
| New York | 23.0 | 0.36 |
| New Jersey | 18.5 | 0.64 |
| New Hampshire | 17.0 | 1.22 |
| West Virginia | 16.1 | 0.58 |
Across all 50 states and the District of Columbia the two line up at +0.31, on a scale where 0 means no connection and 1 means they move in lockstep. States with more brokerages per business tend to sell more. It holds at county level too, but faintly: +0.11 across 1,243 counties. And it is a big-market effect. In the largest quarter of counties it is +0.29. In the other three quarters it disappears. That may be measurement as much as markets: in small counties chance swamps everything, as §06 showed.
Put it head to head with market size
A link on its own proves little. The real test is whether broker density still predicts once the obvious rival explanation — how many businesses are there in the first place — is held constant. So we ran them against each other across the 1,243 counties with at least 400 in-scope locations and a brokerage count that Census publishes.
What moves with how often businesses change hands · County Business Patterns 2023 × SBA 7(a) FOIA FY2020–25, 1,243 counties
| Measure | Against the sale rate | Against the raw number of sales |
|---|---|---|
| Brokerages per 1,000 businesses | +0.11 | +0.31 |
| Brokerages, raw count | +0.09 | +0.75 |
| Inventory density, in-scope share of all locations | +0.07 | — |
| Inventory, raw count of businesses | +0.07 | +0.81 |
Read the two columns separately, because they say different things.
The raw number of sales is explained by size and little else. Big counties have more businesses, more brokers and more deals. Inventory lines up with the deal count at +0.81, which is close to a tautology and tells a buyer nothing.
The rate is a different story, and a much weaker one. Nothing lines up with it strongly. Every measure here is faintly positive, and brokerages per business is the largest of them.
Then the deciding test. Hold inventory constant and ask whether broker density still lines up:
Head to head, with the other held constant · same sources, same 1,243 counties
| Test | Result |
|---|---|
| Broker density → sale rate, holding inventory constant | +0.10, holds |
| Inventory → sale rate, holding broker density constant | +0.03, fades |
How many businesses a place has tells you almost nothing about how often they sell. How many brokers it has per business tells you a little more. Both measured on SBA-financed sales.
That is the nearest thing to a signal in this series, and it is a faint one. How many businesses a market holds tells you almost nothing about whether any of them will sell. How many brokers it holds per business tells you a little. Faint means faint: a link of +0.10 accounts for about 1% of the difference between one county and the next.
Each of these figures is uncertain by about 0.03 either way, so the gap between +0.10 and +0.03 is suggestive, not proven. The result is the same when brokerages are counted against all business locations rather than in-scope ones.
Four things cut against reading too much into it, and we would rather say them than have them found.
- The industry is real estate brokerage, and mostly residential. A firm that only brokers businesses may not be counted in it at all. This stands in for the brokerage layer. It is not a count of business brokers.
- New Hampshire and Wisconsin are clean counterexamples. Two of the thinner brokerage layers in the United States, and two of the five fastest markets. Arizona and Florida are the reverse: thick layers, ordinary markets. Any explanation has to survive all four, and this one does not.
- Brokers may follow deals rather than cause them. A busy market attracts intermediaries. Nothing here settles the direction.
- It is not only brokers. Investment-advice firms show the same pattern in big counties, at +0.26. Accountants show nothing. Law firms run the other way, at −0.19. So this may be measuring how financially busy a place is, rather than brokers as such.
What we can say is narrower than a cause and more than we had. The thickness of the intermediary layer still moves with sale rates once market size is held constant — faintly, and only in large markets. Market size itself does not.
And it is an input that does not travel. The largest lender in the file is based in North Carolina and wrote loans into every state. A broker, as far as we can tell, has to be local.
And the rules just tightened
On 1 October 2026, the SBA replaced the rules governing changes of ownership under 7(a), its main programme. SOP 50 10 8.1, its rulebook for lenders, moved acquisitions into their own appendix. It raised the bar in at least three places and moved a line in a fourth.
What changed on 1 October 2026 · SBA SOP 50 10 8.1 as published 25 September 2026, Appendix 15, against SOP 50 10 8
| Requirement | Before | Now |
|---|---|---|
| Debt service cover, standard acquisition | 1.15× | 1.25× |
| Quality of earnings | Not required | Mandatory at a $3m purchase price |
| Seller-note seasoning before refinance | 24 months | 36 months |
| When the lender may value the business itself | $250,000 or less financed | $350,000 or less purchase price |
SOP 50 10 8.1 with technical policy updates, published 25 September 2026 and effective 1 October 2026, Appendix 15 and the chapter on 7(a) Small and SBA Express loans. "Before" is SOP 50 10 8, effective 1 June 2025. Its 1.15× applied to loans over $350,000, on past or projected cash flow. Projections may now be relied on only for special-purpose property. The 1.25× cover test applies to the standard acquisition, which the rules call an Initial Acquisition, and to owner buyouts and employee-ownership deals. An existing business buying another in its own line stays at 1.15×. The quality-of-earnings requirement covers Initial Acquisition and Business Expansion. Owner Buyout and ESOP deals are exempt. So are purchases of owner-occupied special-purpose property, and the rules give hotels and storage units as examples. Purchase price is measured without owner-occupied real estate. The old valuation test was on the amount financed, less appraised real estate and equipment. A lender may not value the business itself where buyer and seller are closely related.
Each of those is defensible on its own. The first is the one most deals will feel.
For loans over $350,000 that is up from 1.15. At any size it must now be met on past results. The old rulebook let a deal qualify on projections. For the smallest loans a fixed test is new. 3 in 10 acquisition loans under 7(a) are for $350,000 or less, the size the SBA calls a 7(a) Small loan. The old rulebook set no fixed cover test for those and screened them by credit score. The new one gives them a lighter test of 1.10 for other purposes. To buy a business they get no such allowance.
At the top end, a quality-of-earnings report is now mandatory at a $3m purchase price. That is an independent check that the profits are real. About 1 loan in 9 is $2.7m or more, which is the loan a $3m price implies with 10% down. That is a rough cut, and it errs both ways. A fifth of those large loans are for hotels, which are exempt when the building comes with the business. Deals with more cash down are missed. The file records neither prices nor property, so we cannot count it exactly.
At the small end, less changed than was first announced. Under the old rulebook a lender could value the smallest businesses itself, without an outside valuer. The version of these rules the SBA released in August dropped that. The version it published on 25 September, the one in force, kept it and moved the line. The old test was $250,000 or less financed, after taking out appraised property and equipment. The new one is a purchase price of $350,000 or less. About a quarter of 7(a) acquisition loans are for $315,000 or less, which is the loan a $350,000 price implies with 10% down. We cannot say who gains and who loses from the new line. The old test turned on property and equipment, and the loan file records neither.
Every standard acquisition now faces a higher cover test. Roughly a tenth of deals, the largest, need an earnings report too. Roughly the smallest quarter can still be valued by the lender.
That is the squeeze, and it is days old: the rules took effect on 1 October 2026.
One thing we want to be straight about. We can show the rules changed, and we can show the deal sizes they land on. We cannot show what happens next. Whether deals near the new bar now go undone, or are reshaped to clear it, is a reasonable worry and we have no data on it. We know of nobody who tracks what happens to a business after it transfers against how deeply it was checked. We think somebody should.
The one faint signal we found is in the layer of people in the middle. Brokerage density still moves with sale rates once market size is held constant, faintly and in big markets only. One bank writes 1 in 9 of the SBA's 7(a) acquisition loans, and ten lenders write 30%. And on 1 October 2026 the SBA raised the bar. Every standard acquisition now faces a higher cover test, and the largest deals need an earnings report. Lenders may still value the smallest businesses themselves.
Where owners are ageing fastest
The ageing is not spread evenly. It is fastest in the Northeast, and only two of the ten fastest-ageing states sell clearly above the median state.
The ten states whose owners aged fastest · Census ABS state cells, reference years 2017–2023; sale rates from SBA 7(a) FOIA FY2020–25 over Census County Business Patterns 2023
| State | 65+ 2017 | 65+ 2023 | Change | Sales per 1,000 locations a year |
|---|---|---|---|---|
| Maine | 19.4% | 26.1% | +6.6pp | 0.61 |
| Connecticut | 21.9% | 27.8% | +5.9pp | 0.64 |
| Rhode Island | 22.4% | 28.2% | +5.8pp | 0.69 |
| North Dakota | 14.4% | 20.0% | +5.6pp | 0.63 |
| New Jersey | 20.3% | 25.6% | +5.4pp | 0.64 |
| Massachusetts | 20.9% | 26.1% | +5.1pp | 0.70 |
| Mississippi | 23.3% | 28.4% | +5.1pp | 0.78 |
| New York | 19.8% | 24.7% | +4.9pp | 0.36 |
| Ohio | 21.8% | 26.3% | +4.5pp | 1.00 |
| Wisconsin | 17.9% | 22.3% | +4.4pp | 1.47 |
The median state sells 0.73 acquisitions per 1,000 in-scope business locations a year on 7(a) loans, so every state above with a rate under 0.73 is below the median. Seven of these ten are. New York, at 0.36, sits below every state but Hawaii. Changes are worked out before rounding, so a few differ by 0.1 from the two columns beside them. These are survey estimates and carry sampling error, so small gaps in the ranking mean little. State, county and metro rates count 7(a) loans only. Adding the smaller 504 programme lifts the median state to 0.78 and leaves the order almost unchanged. It does carry two states over the line. Rhode Island and Massachusetts rise to 0.82 and 0.79, so on both programmes five of these ten are below the median, not seven.
Six of those ten are in the Northeast. Only Ohio and Wisconsin sell more than a tenth above the median state. Seven of the ten sell below it on 7(a) loans, and five once the 504 programme is added, because Rhode Island and Massachusetts sit right at the line. In New York the over-65 share rose by nearly five points, and the state sells at half the median state's rate: the slowest of the ten.
At the other end, three states show a lower share than in 2017: Kansas by 0.8 points, South Carolina by 0.3, and Idaho by 0.2. Moves that small may be sampling noise. All three sell above the median on either count.
So do older owners mean more sales, as the wave story needs? No. Take all 50 states and the District of Columbia. Rank them by how fast their owners aged, then rank them again by how often businesses there sell. The two orders run slightly opposite: −0.19. With only 51 places to compare, a number that small could easily be chance. Compare the level of owner age instead of the change and the opposite relationship is stronger, at −0.45. Across 1,251 counties the same comparison is much fainter, at −0.07.
That −0.45 is the strongest link with sale rates in this piece. It accounts for about a fifth of the differences between states. States with older owners sell less, not more. We do not know what is behind it. It may be something else about those states, and it is much fainter at county level.
The more useful question for a buyer is a different one: where the turnkey businesses actually are, and how often businesses sell there.
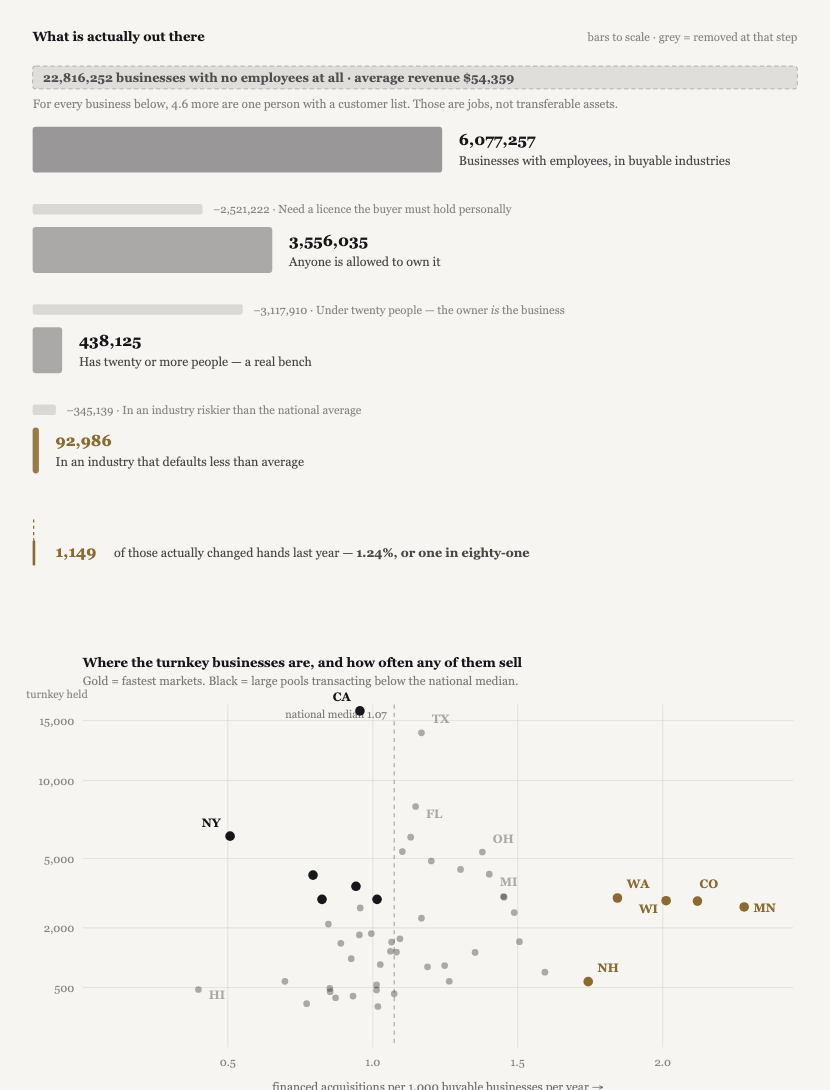
Look at the six biggest pools at the top of the chart, and then at the gold dots. The six largest pools all sell at 0.84 or less. The five fastest states sell at 1.21 or more, and none of them is among the 14 largest pools. Line up all 51 by the share of their businesses that are turnkey, then again by how often businesses there sell, and the two orders barely match. They score +0.11, which with 51 places is no connection at all.
So the practical answer to "where should I look" is not where the most good businesses are. The share of a state's businesses that are turnkey tells you nothing about how often businesses there sell.
Six of the ten fastest-ageing states are in the Northeast, and only two of the ten sell clearly above the median state. Older owners do not mean more sales. States with older owners sell less, and across counties the pattern is much fainter. And how much of a state's inventory is turnkey tells you nothing about how often businesses there sell.
A steady drain, not a wave
Up to here, every estimate has been labelled as one. From here on, everything is an estimate. So we have marked every step as our own arithmetic, and shown three answers instead of one.
Start with the stock. 23.1% of owners are 65 or over. Applied to the 5.9 million employer firms Census counts, that is about 1.4 million businesses. Every one of those owners exits eventually.
One unit warning before the arithmetic. The 23.1% is a share of owners, and we apply it to firms, which treats one owner as one business. Count only the 970,618 owners aged 65 or over in Census's tables, and every figure below is about 30% smaller. The order of magnitude does not change.
Now hold that against the market we can see. The SBA approved financing for 7,112 business acquisitions in fiscal 2025, its best year.
At the pace of the SBA's best year, transferring the businesses owned by people already 65 or over would take about 190 years.
That number is absurd on purpose, and at the SBA's six-year average it would be 240. It only shows how small the SBA's slice is. On our reading the SBA finances about a tenth of sales. And if the only public measure is a guide, most of those businesses will not be sold at all.
Census gives the only guide to how many. Of owners' previous businesses that are no longer theirs, 19% were sold, 58% had closed and 23% were "Other". That comes from the earlier ventures of people who own a business today. It holds no final exits at all, so applying it to retiring owners is our assumption. It may be too low for a going concern with staff. Apply it to today's 1.4 million, and about 260,000 would be sold, about 780,000 would close, and about 315,000 would end some other way.
The exits are already running
§02 gave the pace for older owners, and §03 found a similar one for long-tenured owners: about 8% a year. On 1.4 million businesses that is about 110,000 a year losing their owner, now.
At that pace, half of today's over-65 owners will have left within about 8 years, and two thirds within 13. Nothing has to speed up for these owners to leave.
There is no wave to wait for. The exits are already happening, at a steady pace. If the only public measure is a guide, most of them will not be sales.
Nobody knows how long today's over-65 owners will really take to go. So here are three windows.
Our arithmetic, not a forecast · Census ABS shares, reference year 2023, applied to 5.9 million employer firms
| If today's over-65 owners all exit in… | Businesses losing their owner a year | Sales a year if 19.2% sell | Extra sales a year per 10 more points sold |
|---|---|---|---|
| 10 years | 136,000 | 26,100 | 13,600 |
| 15 years | 91,000 | 17,400 | 9,100 |
| 20 years | 68,000 | 13,100 | 6,800 |
Assumes 1.36 million businesses with an owner aged 65 or over (23.1% of 5.9 million), the 19.2% sold share, and that every one of those owners exits inside the window. Each is an assumption, not a measurement.
Today's pace of about 110,000 a year sits between the first two rows. The last column is the one that should worry people. Suppose the aim is modest: one more exit in ten ending in a sale instead of a closure. At today's pace that takes about 11,000 more sales a year.
So the honest forward statement is narrow and still useful. The exits are not arriving as a spike. They are a long, steady flow that is already under way. The market does not need to speed up to keep closing most of these businesses. It would need to grow by about a fifth to do a little better.
What would have to grow
Not the supply of credit, as far as we can see. SBA acquisition lending reached $8.5bn in fiscal 2025, the highest since the agency began flagging acquisitions in fiscal 2018. And the loans that get made carry the same term and guarantee in the fastest and slowest markets.
Not inventory. There are 92,986 businesses that pass every filter, and about 204 of them sell with SBA financing in a year.
Our best guess at what is scarce is the person standing between a seller and a buyer. We examined 13 explanations for why some markets sell and others do not. None held up. The one that looked clearest, broker licensing, turned out not to depend on the licence. What is left is a faint link with how many brokerage offices a place has. If more of these businesses are to be sold rather than shut, this is the part of the system we would look at first. It is also a part that does not travel the way credit does.
We can partly show it. Census counts real estate brokerage offices in every state and county, which is the nearest public measure of where business brokers are. Brokerage density lines up with sale rates at +0.31 across the 50 states and the District of Columbia. Across counties it is fainter, but it is still there once market size is held constant. It is a proxy rather than a count, and New Hampshire and Wisconsin break it.
What would change our mind
- The 2024 and 2025 owner files. The series stops at 2023. If the 55-and-over share jumps in either, the premise of this piece weakens and we will say so.
- The SBA's own count. SBA-financed acquisitions rose from 4,876 in fiscal 2023 to 7,112 in 2025, and 2026 is holding that pace. As a share of 7(a) loans they are still below where they stood in 2020. If that share climbs past its 2020 level of 13.6%, that is a wave showing up in sales, and this piece is wrong about timing.
- A real census of business brokers. Our proxy is real estate brokerage offices, which are mostly residential agents. If a proper count showed no relationship, the reading above is wrong.
- Any count of sales made without an SBA loan. On our reading they outnumber SBA-financed sales by about nine to one. If they turn out to be common exactly where SBA-financed sales are rare, most of the geography in this series is an artefact.
About 1.4 million businesses have an owner aged 65 or over. At the SBA's best pace that is 190 years of work, which only shows how small the SBA's slice is. Those owners are already leaving at about 8% a year, and if the only public measure is a guide, most of their businesses will not be sold. Selling one more in ten would take about 11,000 more sales a year, a fifth more than we estimate happen today. Our best guess at what would have to grow is the layer of people in the middle, and nobody counts it.
What this data does not say
1. "Ageing owners will force a wave of sales"
Seven annual readings show no sign of it. The 55-and-over share is flat. Older owners left at about 8% a year across those readings. And states with older owners show fewer SBA-financed sales, not more.
Here is the limit of that claim. Comparing 51 whole states is a blunt tool. We ran the same test on 1,251 counties, and the pattern was much fainter, at −0.07. It is also a comparison across places, not across time, so it cannot settle a forecast by itself. The defensible version is the narrow one: where owners are older, businesses do not sell more. Not enough to claim the reverse.
2. "There are trillions on the sidelines waiting to buy these businesses"
We found no public data showing an idle pool of money aimed at this market. The median 7(a) acquisition loan is $675,000, and 63% of the loans are under $1 million.
Meanwhile the credit that does serve this market is at a high. SBA acquisition lending reached $8.5bn in fiscal 2025, up 31% on the year before and the highest since the SBA began flagging acquisitions in fiscal 2018. And loans in the fastest-selling states carry the same term and guarantee as loans in the slowest, at interest rates within three quarters of a point.
We see no sign that capital is what holds this market back. Two limits on that. Both tests look only at loans that were made, because nobody publishes the ones that were refused. And both predate the October 2026 rules.
3. "The wave is just delayed"
Delay implies arrival. This is the comfortable version, and it is what we expected to find.
What the data shows is a share that is not growing, with owners already leaving at a steady pace. If the only public measure is a guide, most of those exits do not end in a sale. That is not a delayed wave. It is a steady drain, and a drain does not turn into sales by waiting.
If you are in this market
If you are selling
- Your industry shapes your buyer pool before a buyer ever sees your numbers. A licensed trade at its core, or a poor record with lenders, narrows the pool from the start.
- Waiting for the wave is not a plan. Seven readings on, the share of owners near retirement is unchanged, and older owners have been leaving throughout.
- If you are in the Northeast, your state is probably not a fast market. Only New Hampshire sells more than a tenth above the median state, and six of the ten fastest-ageing states are there.
- More than ten long-tenured owners leave the data for every SBA-financed sale. On the only public count, three businesses have closed for every one sold. Decide deliberately which group you intend to be in.
If you are buying
- We could not measure buyer competition directly. Three indirect tests found nothing, and a fourth could be read either way. On the only public count, most businesses that end are closed, not sold.
- Staff count is the screen you can actually measure. We use 20 employees as a judgement call for whether a business survives its owner. Census does not publish how many firms clear both a staff bar and a revenue bar.
- Do not pick a market by how much good inventory it holds. That tells you nothing about how often businesses there sell.
- Loans that get made carry much the same terms everywhere. We cannot see the ones that were refused.
- 100 applications to start an employer business are filed for every SBA-financed purchase of one. Ask honestly which is the better route to the thing you actually want.
If you are advising
- Stop sizing the opportunity from owner age. It does not predict more sales, and we tested it three ways.
- Stop quoting business counts that include people with no employees. That is 83% of them, at an average of $57,611 in revenue.
- If you quote the $10tn figure or "10,000 retiring a day", be ready to source them. We could not trace the first. The second is a 2010 Pew estimate of people turning 65, not of owners retiring.
- The useful number is 92,986. The useful rate is 1 in 457 a year with SBA financing, or perhaps 1 in 45 by every route. The fourth piece in this series names the 34 industries.
I could be wrongAssumptions, gaps and limits
Assumptions
- That the owner survey's percentages hold for the firms that did not answer. Census's owner tables cover 54.6% of the businesses it could classify, with no adjustment for the rest. We apply their percentages to all 5.9 million employer firms. If the firms that did not answer are different, every scaled count in this piece moves.
- That one owner is one business. We turn shares of owners into numbers of businesses. Firms with several owners make that rough. The 5.9 million also includes firms with no individual owner, which makes scaled counts a little high.
- That the percentages are comparable across seven readings. The number of owners the tables cover ranged from 3.52m to 4.73m. If the owners missing in a thin year were older or younger than average, the percentages move too.
- That ages are spread evenly inside the 55-to-64 band, and that the number of owners did not change. The 4-in-10 figure in §02 rests on both. A reasonable range is 35% to 45%.
- That "acquired before 2000" is a fair stand-in for long tenure. It is a fixed window, so the group inside it can only shrink. That is why we read its decline as a rate rather than measuring its size.
- That SBA-financed sales are a fair proxy for all sales. They are not. Our three rough cuts put the SBA at about a tenth of business sales; seller notes, cash, private credit and conventional bank debt carry the rest. McKinsey's model would put it nearer a fifth. Every transaction count in this series is therefore a floor. And if that unseen share is geographically uneven, the New York figure in particular could be a financing-mix artefact rather than a liquidity one.
- That owners arrive and leave at the same rate. The sellers' cuts in §03 assume the number of owners is steady, so the 4.5% who arrive each year are matched by 4.5% who leave.
- That the sold share of owners' earlier start-ups applies to established businesses. It is the only public measure of sold against closed, and it comes from the previous ventures of people who own a business today. It holds no final exits. A going concern with staff may sell more often than that. If so, the sales in §09 are understated.
- That a strict licence screen is the right one. We keep only industries with no licensed profession or trade at their core. That sets aside 481,079 firms a buyer can own and 438,800 we could not classify. Counting them would raise every figure below the second fork. The screen also ignores ordinary business permits, such as a liquor licence.
- That twenty employees is the right line for "survives the owner leaving." Ten gives 815,603 firms and fifty gives 174,050. The third row of the four forks moves nearly fivefold with that choice. The count also stops at 999 employees.
- That an industry needs 1,000 such firms to be ranked. Without that bar, 76 industries pass the risk test rather than 34, holding 113,624 firms rather than 92,986. The turnover figure becomes 1 in 421 rather than 1 in 457.
- That a line at the average is the right risk test. 16 of the 34 industries are below 7.13% by less than chance could produce. A stricter test keeps 18 industries and 53,552 businesses.
Data gaps
- No owner file for 2024 or 2025. The series stops at 2023. If a surge began in 2024 we could not yet see it in owner ages, and we will check when Census publishes.
- No count of transfers that did not use SBA financing. Nobody publishes one. This is the largest hole in the whole series.
- No direct count of business brokers. We proxy it with Census establishment counts for real estate brokerage, the nearest public measure. The proxy lines up with sale rates and survives a size control, but only faintly and only in large markets. It is dominated by residential agents, and New Hampshire and Wisconsin are clean counterexamples.
- No sale prices. The loan file records loans, not prices. Where we talk about price we are reading it off loan size.
- No loans that were refused, no listings, no count of buyers. Every credit test here looks at loans that were made. Nothing here measures what is offered for sale or who is looking.
- No two-way count of revenue and staff. Census publishes average revenue by staff band in census years. It does not publish how many firms clear both a staff bar and a revenue bar, which is what a buyer actually wants.
Limitations
- The departure rate is an order of magnitude, not a count. It pools retirements with closures, deaths, moves out of the employer universe, and survey error, and it counts owners rather than businesses. On the survey's own totals it is 59,000 to 79,000 a year. Scaled to every employer firm it is about 110,000 on the six-year average, and about 82,000 at the group's size today.
- The fourth fork can only rate 74% of what it filters. Just 175 industries have both a bench count and enough seasoned SBA loans to rate, holding 322,340 of the 438,125 firms. The rest are unmeasured, not unsafe.
- The risk test is built on every kind of SBA loan. The agency has flagged acquisitions only since fiscal 2018, so the ten-year file is mostly other lending. And 82% of the loans that report a size went to businesses with fewer than 20 jobs. It ranks industries. It does not rate larger businesses, or acquisitions as such.
- Census counts a firm once in each industry it operates in. For firms with 20 to 999 staff that adds 11% across the United States: 687,353 industry rows against 616,772 separate firms. So the 92,986 is nearer 84,000 separate firms, and 1 in 457 is nearer 1 in 410.
- The firm counts include nonprofits. Census does not separate them. We remove membership and religious organisations, but nonprofits elsewhere stay in. Two of the 34 industries are obvious cases: services for the elderly and disabled, and golf and country clubs. We cannot say how many of the 92,986 that removes.
- The firm counts are a pandemic-year snapshot. Census took them in March 2021. Its County Business Patterns series shows 6% fewer business locations with 20 or more staff that year than in 2019, and 8% fewer than in 2023. Hotels were 31% below 2019 and full-service restaurants 20% below. So the staffed tiers are understated.
- Business size comes from the lender. The jobs figure on each loan is self-reported and unaudited. It is the only way to tell which SBA-financed sales were of businesses with 20 or more staff. The 204 a year and the 1 in 457 rest on it.
- One loan is counted as one sale. A purchase carried on two SBA loans would count twice. The change-of-ownership flag also covers partner buyouts, which are not sales of a whole business.
- The maps count locations, not firms, and 7(a) loans only. Census publishes county detail by establishment, so each branch of a chain counts once. It also withholds cells with fewer than 3 establishments; we put those back from industry-group totals, which is an estimate. Adding the 504 programme moves the median state from 0.73 to 0.78 and barely changes the order. It does carry Rhode Island and Massachusetts just above the median, and Florida and Texas just below it.
- Small places bounce. Half of the county-to-county spread is what chance alone would produce. The spread among large metro areas, 2.3 times, is the figure to trust. County tests with a faint result may be faint because of that noise.
- The nonemployer comparison mixes units. Nonemployers are counted from tax returns and employer businesses as firms, in different years, 2023 and 2021.
- The state ageing result compares whole states, which can hide what is happening inside them. There are only 51 to compare, and the pattern is much fainter at county level. State-level patterns in this data have burned us before, so treat every geographic claim as scale-dependent.
- The number of owners the tables cover swings. It was highest in 2017 and lowest in 2020, and it jumped 24% between 2020 and 2021. Nearly half of the six-year rise in the over-65 share sits in that one step. We have not excluded any year. Every band moves in the same direction with or without the 2020 and 2021 readings; the size of the move is less certain.
- The latest year is flattered a little. We leave out cancelled loans, and recent loans have had less time to be cancelled. That may lift fiscal 2025 against the years before it.
- Ruling explanations out does not rule one in. None of the 13 explains the spread. That is an absence of evidence, which is a weaker thing than a finding.
- The forward arithmetic is arithmetic, not a forecast. It assumes the 19% sold share holds and that every over-65 owner exits inside the window. Change either and the numbers move. We show three windows rather than one because we cannot defend a single number.
- The intermediary reading is a reading, not a result. The broker-licensing gap turned out not to depend on the licence. The density measure is faint, +0.11 across counties, and absent outside the largest quarter of them.
The main numbers, and where each came from
The figures the argument rests on, each with its source and its type, so you can check any of it. Measured means somebody counted it. Survey estimate means a weighted figure from a sample survey, which carries sampling error. Measured + our rule means a count that depends on a screen we chose. Published means the agency states it. Estimate means we worked it out from measured figures and a stated assumption. Modelled means somebody else estimated it from assumptions of their own.
The main figures, with source, vintage and type
| Figure | Value | Source | Type |
|---|---|---|---|
| Owner age shares, 65+ and 55+ | 20.1→23.1% · 50.8→51.3% | Census ABS, ref. years 2017–2023 | Survey estimate |
| Owners in the age tables, by year | 3.52m to 4.73m; 4,208,231 in 2023 | Census ABS, owners of the firms that answered | Survey estimate, not a national total |
| Owners 55+ / 65+ in the firms that answered | 2,157,838 / 970,618 | Census ABS, ref. year 2023 | Survey estimate, not a national total |
| Share of classifiable businesses in the owner tables | 54.6% | Census Bureau, Annual Business Survey methodology, 2024 survey | Published |
| Employer firms in the owner survey's universe | about 5.9 million | Census Bureau release CB25-TPS.77, 20 November 2025 (2024 survey, ref. year 2023) | Published |
| Businesses with an owner aged 65 or over | about 1.4 million | 23.1% applied to 5.9 million firms | Estimate |
| Owners aged 59+ in 2017 who had gone by 2023 | about 4 in 10; 8% a year | Census ABS age bands, §02; range 35% to 45% | Estimate |
| Previous business closed / sold / "Other" | 355,740 / 118,465 / 142,904 (58% / 19% / 23%) | Census ABS, ref. year 2023, status of the previous business the owner started | Survey estimate |
| Sold, of closed-or-sold, in each reading 2019 to 2023 | 25% to 27% | Census ABS, ref. years 2019–2023 | Survey estimate |
| Owners who acquired before 2000, share of all owners | 29.2% → 17.9% (1,384,627 of 4,737,543; 755,229 of 4,214,749) | Census ABS, ref. years 2017–2023 | Survey estimate |
| Businesses losing a long-tenured owner, per year | about 110,000 on the six-year average; about 82,000 at today's size | 1.9 points a year, or 7.8% of 17.9%, applied to 5.9 million firms | Estimate |
| Owners new to their business each year | 4.5% (181,800 / 207,606 / 181,013 of 4,214,749) | Census ABS, ref. year 2023, acquired in 2020, 2021, 2022 | Survey estimate |
| Owners who bought their business | 22.1% (1,045,566 of 4,737,543 in that table) | Census ABS, ref. year 2017 | Survey estimate |
| Business sales a year, by every route | 51,000 to 66,000 | Our three cuts, §03 | Estimate |
| SBA share of all business sales | about a tenth (8% to 11%); nearer a fifth on McKinsey's count | 5,638 a year against those three cuts; McKinsey models about 25,500 sales in 2022 | Estimate |
| Businesses with no employees / average revenue | 30,427,808 / $57,611 | Census Nonemployer Statistics, 2023, all sectors | Measured |
| Employer firms: all / counted once in each industry / after our exclusions | 6,294,604 / 6,404,038 / 6,077,257 | Census SUSB, 2021 firm-size tables | Measured + our rule |
| …no licensed profession or trade at the core | 3,556,035 (58.5%) | SUSB 2021 × BLS OEWS May 2024, our classification | Measured + our rule |
| …licensed owner / staff or premises / unclassified | 1,601,343 / 481,079 / 438,800 | Same | Measured + our rule |
| …with 20 to 999 employees (10 and 50 also shown) | 438,125 | Census SUSB 2021 | Measured + our rule |
| …in 34 industries: below the loan-file rate, 1,000+ such firms each | 92,986 | SUSB 2021 × SBA 7(a) FY2010–19 | Measured + our rule |
| …of which in industries below the rate by more than chance | 18 industries, 53,552 | Same | Measured + our rule |
| …dropped at that fork: riskier / unrated / small industry | 208,716 / 115,785 / 20,638 | Same | Measured + our rule |
| Industries the risk test can rate / firms they hold | 175 / 322,340 of 438,125 | Same | Measured + our rule |
| Firms with 20 to 999 staff: industry rows against separate firms | 687,353 / 616,772 (11% more) | Census SUSB 2021, all industries | Measured |
| The 92,986 as separate firms | about 84,000 | National overlap applied band by band | Estimate |
| Loan-file all-industry charge-off rate | 7.13% of 479,007 loans | SBA 7(a) FOIA, approved FY2010–19, as of 30 June 2026 | Measured |
| Charge-off by business size | 7.74% → 5.09% | Same; size is lender-reported jobs | Measured |
| SBA-financed acquisitions by fiscal year, 2019 to 2025 | 5,685 / 5,062 / 6,185 / 4,808 / 4,876 / 5,782 / 7,112 | SBA 7(a) FOIA as of 30 June 2026; 504 FOIA as of 31 March 2026 | Measured |
| SBA-financed acquisitions a year, FY2020–25 | 5,638 both programmes; 5,446 under 7(a) | Same | Measured average |
| 7(a) acquisitions, October to June: fiscal 2025 / 2026 | 5,048 / 4,420 (none recorded in October 2025) | SBA 7(a) FOIA as of 30 June 2026 | Measured |
| All 7(a) loans, fiscal 2022 / 2025; acquisitions' share of them in 2020 / 2022 / 2024 / 2025 / 2026 to June | 42,282 / 64,096; 13.6% / 10.9% / 8.9% / 10.7% / 12.4% | Same | Measured |
| 7(a) acquisition loans / lenders / share of the top 1, 3 and 10 | 32,677 / 1,444 / 11.0%, 19.2%, 29.7% | SBA 7(a) FOIA, FY2020–25, cancelled loans excluded | Measured |
| Median 7(a) acquisition loan; share reporting 20+ jobs, fewer, none | $675,000; 19.5%, 77.8%, 2.7% | SBA 7(a) FOIA; jobs shares on both programmes, FY2020–25 | Measured |
| 7(a) acquisition loans under $1m / of $315,000 or less / $350,000 or less / $2.7m or more; hotels' share of the last | 63.1% / 26.4% / 30.5% / 11.1%; 21.5% | SBA 7(a) FOIA, FY2020–25 | Measured |
| SBA acquisition lending, fiscal 2025 | $8.5bn, up 31%; highest since FY2018 | SBA 7(a) and 504 FOIA | Measured |
| Sales in the 34 industries per year: all sizes / 20+ jobs | 1,138 / 204 (1,221 in six years: 1,176 under 7(a), 45 under 504) | SBA 7(a) and 504 FOIA, FY2020–25 average | Measured + our rule |
| Turnover with SBA financing: the good set / same size, all in-scope industries / every size | 1 in 457 / 1 in 567 / 1 in 942 | SBA 7(a) and 504 FOIA FY2020–25 over SUSB 2021 | Measured + our rule |
| Applications with planned wages, per year | 567,265 | Census BFS, October 2019 to September 2025 | Measured |
| New York City and Marinette County: locations / sales | 120,421 / 102 · 564 / 17 | Census County Business Patterns 2023 × SBA 7(a) and 504 FOIA FY2020–25 | Measured, small cells estimated |
| Fast market against slow market: 1,253 counties / 40 largest metros | 6.5× (3.5× by chance alone) / 2.3× (1.2×) | Census County Business Patterns 2023 × SBA 7(a) FOIA FY2020–25; chance from a simulation at one common rate | Measured, small cells estimated |
| Median state sale rate | 0.73 per 1,000 in-scope locations a year (0.78 with 504) | Same | Measured + our rule |
| Locations with 20+ staff in the 34 industries, all states | 140,745 | Census County Business Patterns 2023 | Measured + our rule |
| State ageing changes (ME +6.6pp …) | table in §08 | Census ABS state cells, ref. years 2017–2023 | Survey estimate |
| Owner age against sale rates | −0.19 change, −0.45 level (51 states); −0.07 level (1,251 counties) | Census ABS state and county cells × our sale rates | Measured link |
| Brokerage density against sale rates | +0.31 (51 states) / +0.11 (1,243 counties) | Census County Business Patterns 2023 × SBA 7(a) FOIA FY2020–25 | Measured link |
| States on brokers' licensing lists against the rest: sale rate / brokerage offices | 15 listed: 1.28× (metros 1.19×); the 7: 1.25×; the 8: 1.24× / 44 against 31 | Brokers' lists; state licence laws read 5 October 2026; our sale rates and Census counts | Measured; laws as we read them |
| Loan size against sale rate | −0.30 across 61 metros | SBA 7(a) FOIA: each loan over the national median for its industry | Measured link |
| Rule changes of 1 October 2026 | table in §07 | SBA SOP 50 10 8.1 with technical policy updates, published 25 September 2026, Appendix 15; SOP 50 10 8, effective 1 June 2025 | Rule text |
| Years to transfer at the SBA's pace: best year / six-year average | about 190 / about 240 | Our arithmetic, assumptions listed in §09 | Estimate |
| Extra sales a year to turn one more exit in ten into a sale | about 11,000, a fifth more than all sales today | Same | Estimate |
| Viable sale candidates in the coming ownership transfer / share that could close | ≈1m of 6m transitioning; up to 92%; close to $5tn | McKinsey Institute for Economic Mobility, "The Great Ownership Transfer: A new era of business stewardship" (2026); figures as stated on The McKinsey Podcast, 14 May 2026 | Modelled, external |
| McKinsey's estimate of exits in 2022: closed / sold / transferred | 510,000 exits; 92% / 5% / 3% | McKinsey Institute for Economic Mobility, "The Great Ownership Transfer", 26 February 2026 | Modelled, external |
Every count here is downloadable by anyone, for nothing, and recomputable. SBA figures are from the agency's own loan-level FOIA releases, with data as of 30 June 2026 for 7(a) and 31 March 2026 for 504. Census ABS is the Annual Business Survey owner-characteristics tables, which publish as free flat files. Two inputs are not counts we could recompute. One is the list of states that brokers say license them. We read the 15 state laws, and by our reading 7 cover the sale of a business as such. The other is McKinsey's modelled figures.
How to check this yourself
How the datasets fit together
Nine public datasets carry this piece, and the SBA's 7(a) file is used twice, on two approval windows. They have different vintages and different units, and many of our ratios join two of them. Here is the plumbing, in one place.
Every dataset, its vintage, and the cutoffs applied
| Dataset | Vintage | What it provides | Cutoffs and rules |
|---|---|---|---|
| Census Annual Business Survey | ref. 2017–2023 | owner ages, status of the owner's previous start-up, year acquired, how acquired (2017 only) | a sample survey, weighted; national all-owners cell; up to four owners a firm; firms that answered only, so percentages are used and counts are scaled; every year kept |
| Census SUSB firm-size tables | 2021 | the 6,077,257 spine and every employee tier | aggregate parent codes dropped; membership and religious organisations, funds and holding companies removed; tiers stop at 999 employees; a firm is counted once in each industry it operates in |
| Census Nonemployer Statistics | 2023 | 30.4m no-employee businesses, $57,611 average receipts | all-sector national total |
| Census County Business Patterns | 2023 | business locations by state and county; brokerage offices, NAICS 531210 | counts locations, not firms; county tests need ≥400 in-scope locations; cells under 3 establishments are withheld and estimated back |
| Census Business Formation Statistics | Oct 2019–Sep 2025 | applications with planned wages | same six fiscal years as the SBA counts; compared with them, never joined |
| BLS Occupational Employment and Wage Statistics | May 2024 | which industries are built around a licensed profession or trade | owner gate: occupation ≥5% of industry jobs and ≥5× its economy-wide share |
| Current Population Survey | 2025 | a check on the licence list | our list reproduces 21.6% of workers licensed, against the 21.6% BLS publishes |
| SBA 7(a) FOIA, seasoned window | approved FY2010–19, as of 30 Jun 2026 | charge-off rates by industry and size | loans of every purpose; cancelled loans excluded; industries need ≥300 loans; every rate is a floor |
| SBA 7(a) FOIA, current window | approved FY2020–25, as of 30 Jun 2026 | acquisition counts, loan sizes, lenders, geography | "Change of Ownership" flag; cancelled loans excluded; six full fiscal years, so every yearly average is the total divided by 6 |
| SBA 504 FOIA | approved FY2020–25, as of 31 Mar 2026 | acquisitions under the second programme | same flag; cancelled loans excluded; included in national totals and in the good set's sales; state, county and metro rates use 7(a) alone |
How the owner survey is scaled. The survey is a sample. Census asked about 330,000 employer businesses for the 2023 reading and weights each answer by the firm's chance of being picked. Its owner tables include only the firms that answered. Its methodology for this survey says they cover 54.6% of the businesses it could classify and carry no adjustment for the rest. It says they "are not intended to estimate total owners with each characteristic". The 2023 table holds 4.2 million owners against 5.9 million employer firms, which cannot be a full count. So we use the survey's percentages and, where a national number is needed, apply them to the 5.9 million employer firms Census reports for the same survey. That assumes the firms that did not answer look like the ones that did, and it treats one owner as one business.
Two counts of employer firms appear here. Statistics of US Businesses counts 6,294,604 for 2021 and has the size bands, so the four forks are built on it. The Annual Business Survey counts about 5.9 million for 2023, and it is the owner survey's own universe, so the owner percentages are scaled to it. They differ in year and in a few industries each leaves out.
Where ratios cross datasets, and why that is tolerable. Many of our ratios join two sources. These carry the most weight. The 83% no-employee share pairs 2023 nonemployer counts with 2021 employer counts; both are slow-moving stocks, and two years of drift cannot move an 83/17 split far. The sale rates for states, counties and metros divide FY2020–25 sales by 2023 business locations, on one industry list for both. The denominator is the same vintage for every market, so rankings between markets hold even if levels drift. The 1-in-457 figure divides sales by 2021 firm counts. The broker test pairs 2023 brokerage counts with the sale rates. And the size of the unseen market rests on owner turnover and sold shares from one survey, which is the piece's loudest labelled assumption.
One industry list on both sides of every rate. A sale counts toward a place or an industry only if its industry is in the Census list we divide by. "In scope" means one thing throughout. The industry has no licensed profession or trade at its core. And it is not one the SBA cannot or mostly does not finance, such as banking and passive property holding. It is narrower than "anything a buyer could own". From 2022 lenders began recording a newer set of industry codes, which re-coded much of retail. We mapped each new code back to the old one only where the official titles describe the same industry, which moved 3,329 loans.
The time cutoffs that shape everything. Charge-off rates stop at FY2019 approvals because newer loans have not had time to fail. The SBA has flagged acquisitions only since FY2018. We use the six full fiscal years from 1 October 2019 to 30 September 2025, and show the part-year after that only for comparison. Figures for fiscal 2025 alone are labelled as such. The owner series ends at reference year 2023, and its flows are averages over 2017 to 2023 or 2020 to 2022. Anything that happened after those dates is invisible to this piece, and §09 says what would change our mind.
One programme or two. National totals and the good set's sales count both SBA programmes. State, county and metro rates count 7(a) alone, which carries 96% of the in-scope loans. We rebuilt those rates with 504 added and re-ran the spreads, the chance baselines and the owner-age, brokerage, licensing, loan-size, lender and turnkey-share tests. The order of states barely changes, and every one of those results holds. Each link keeps its sign, and all but one its rough size. The turnkey-share link falls from +0.11 to +0.02, and both mean no connection. What does move is any count of states either side of the median. Rhode Island, Massachusetts, Florida and Texas all sit within a few hundredths of it. So we give those counts both ways, or avoid them.
Chance. To see how much of the spread between places is noise, we gave every county the same pooled sale rate. We drew six years of sales at random and measured the gap between fast and slow. That gap is 3.5 times for counties with at least 400 in-scope locations and 1.2 times for the 40 largest metro areas. For the risk line, an industry counts as clearly different from 7.13% when the gap is more than twice what sampling alone would produce at its number of loans.
Owner ages, tenure and the status of owners' previous businesses come from the Census Annual Business Survey, owner-characteristics tables. They cover reference years 2017 through 2023, collected in the 2018–2024 surveys, and publish as free flat files with no API key needed. We used the national all-owners cell. Census asks about up to four owners in each firm. County owner ages use the 1,251 counties with at least 400 in-scope locations where the tables cover at least 200 owners. One trap: the 2022 and 2023 vintages code industry on the 2022 NAICS revision and earlier ones on 2017, so stacking them naively drops the later years.
Nonemployer counts and receipts come from Census Nonemployer Statistics, 2023: the national total for all sectors, set against the 6,294,604 employer firms Census counts in 2021. That pairing mixes a 2023 count with a 2021 one — the latest we hold of each — and two years of drift does not move an 83/17 split materially. Census's own combined count for 2023 is 36.4 million businesses, against the 36.7 million this pairing gives. The examples by industry compare the same two sources industry by industry.
Firm counts and employee tiers come from the Census Statistics of US Businesses 2021 firm-size tables. Census counts 6,294,604 employer firms, and 6,404,038 once a firm is counted in each industry it operates in. From that second figure we remove membership and religious organisations (298,312), holding companies and head offices (26,623) and funds and trusts (1,846). That leaves the 6,077,257. Five things to know. Counting a firm in each of its industries changes nothing below 20 staff. It adds 11% for firms of 20 to 999, and multiplies the count of firms with 1,000 or more several times over. Census does not separate nonprofits, so those outside the industries we remove are still in. The tiers are built from Census's size bands and stop at 999 employees. The counts are a March 2021 snapshot, taken mid-pandemic, when staffed businesses were unusually few. And the 2022 release, which adds receipts, counts 6,183,712 on the same definition, about 106,000 more; we stay on 2021 because the employee tiers we hold are in that release.
The licence classification is ours, built from BLS Occupational Employment and Wage Statistics (May 2024). It flags professions and trades, not business permits. We checked the list behind it against 2025 Current Population Survey microdata, where it reproduces the 21.6% of workers that BLS reports as licensed. The third piece documents it in full.
Charge-off rates come from 479,007 seasoned SBA 7(a) loans approved FY2010 to FY2019, of every purpose. We exclude cancelled loans, treat a non-empty charge-off date as a default, and keep industries with at least 300 loans. The all-industry rate is 7.13%. Acquisition counts come from the FY2020-present 7(a) release and the 504 release, where SBA's business-age field reads "Change of Ownership", for loans approved in fiscal years 2020 to 2025. Lenders do not flag every acquisition that way, and nothing outside the SBA is counted, so every acquisition count here is a floor. Recent loans have had less time to be cancelled, which flatters the latest year a little.
The price test in §06 uses loan size, because the file holds no prices. Each loan is divided by the national median loan for its industry, and a metro's figure is the median of those across its deals. The broker-licensing test compares single-state metros only. The 13 explanations, with every result, are in the fifth piece.
Every count in this piece was recomputed from those source files before publication rather than carried forward from our notes. Each was recomputed again on a single set of definitions. Then the text was read cold three times, and its corrections a fourth time, for claims the numbers could not carry. That process caught errors, and we would rather list them than hide them. The first diagram originally implied its prior-business rows sat inside the 65-and-over group, which Census does not support. An earlier version claimed the six fastest-ageing states were all in the Northeast; North Dakota is fourth. A claimed all-time SBA lending peak of $37.3bn was wrong, though acquisition lending did reach $8.5bn, its highest since the SBA began flagging acquisitions. Earlier drafts labelled everything a fork removed with a single reason, when each fork removes several kinds of business; the diagram now itemises them. They counted every SBA-financed sale in the 34 industries, 1,149 a year on the old count, against the 92,986. Only about one sale in five is of a business that size. That is why 1 in 81 became 1 in 457. They mixed approval windows; the SBA counts now sit on the same six fiscal years.
The cold reads caught the larger ones. Earlier drafts read the age chart as the same owners staying on and getting older; the bands show about 4 in 10 older owners leaving in six years. They set head counts from Census's owner survey against the SBA's complete loan counts, although the survey covers only the firms that answered. That made the SBA look as if it financed about a quarter of sales; on all owners and like for like it is about a tenth. They described Census's prior-business question as covering any business an owner had left, when it covers the previous business the owner started. They described the SBA's new rules from the version released in August. The SBA published updates on 25 September, before the rules took effect. Those kept the lender's own valuation for the smallest deals and kept the smallest loans open to acquisitions. They said the big pools were the slow markets, when only one of the six biggest, New York, sells far below the median state. They gave the spread between counties without saying half of it is chance. And they left the SBA's second loan programme out of the good set's sales. They called the owner survey a count of people who answered, when it is a weighted sample. And they counted states either side of the median without checking that the count held on both loan programmes. They reported a broker-licensing result from a list brokers publish. Read against the state laws, the gap does not depend on the licence.
October 2026Piece 1 of 5
Every count here comes from public data: SBA 7(a) and 504 FOIA loan files. BLS Occupational Employment and Wage Statistics. Five Census programmes — Annual Business Survey, Statistics of US Businesses, Nonemployer Statistics, County Business Patterns, Business Formation Statistics — and the Current Population Survey. Two inputs are not counts: a broker-published list of licensing states, and McKinsey's modelled figures. Both are labelled where they appear. No client data and no deal names appear anywhere in this series.
Rule statements reflect SBA SOP 50 10 8.1 as published on 25 September 2026, in effect since 1 October 2026.
Sources
Every count in this piece was recomputed from the primary series below. The SBA 7(a) and 504 loan-level FOIA extracts are the deal-level record behind every transaction figure; they are released by the SBA on request and are not linked here because the published download path moves between releases.
- Census Annual Business Survey — owner characteristics, reference years 2017 to 2023
- Census Statistics of US Businesses — 2021 firm-size tables
- Census Nonemployer Statistics — 2023
- Census County Business Patterns — 2023
- Census Business Formation Statistics
- BLS Occupational Employment and Wage Statistics — May 2024
- SBA SOP 50 10, lender and development company loan programs — the in-force text is SOP 50 10 8.1 with technical policy updates, published 25 September 2026 and effective 1 October 2026

Avery Hastings, CPA
Founder, Acquidex • CPA • Tokyo, Japan
Avery Hastings is a CPA based in Tokyo, Japan and the founder of Acquidex. She focuses on helping buyers evaluate small-business deals with clear cash-flow logic, realistic downside analysis, and practical diligence frameworks.
Keep up with Avery →Sources
Keep Reading
- Do Overconfident Buyers Pay More for Small Businesses?18 min read read
A landmark study on Forbes 500 CEOs shows overconfident executives have 65% higher odds of making an acquisition, and the market reacts 90 basis points more negatively to their deals. The mechanism transfers to private-market buyers. The measurement does not. Here is what a buyer-side test would actually look like.
- The Formation Boom Is Real. The Pipeline Inside It Is Shrinking.13 min read
Business applications just hit a June record — but the share that becomes an employer business you can actually buy has fallen to the lowest level on record, and it's rotating hard by sector.
- Why Most Small Businesses Close Instead of Selling: 104 Industries, Ranked26 min read read
A roadside motel will sell. A law practice records thirteen times the closures per sale. Census data on 104 industries shows the difference is not profit, size, or how well the business was run.
- Why Does Walking Away Get Harder After the LOI?13 min read read
A deal's structure adds commitment on a schedule while diligence is supposed to keep the decision open. What fifty years of research says about that tension, new evidence from actual acquisitions, and where the evidence stops.