


Key Insight
SBA 7(a) loans approved in FY2023 charged off at 2.515% within 36 months of approval, the highest rate since 2010 and roughly 1.87 times the FY2019 pre-pandemic baseline of 1.347%. The deterioration is confirmed by a second cohort: at the 24-month mark FY2024 is running 1.74 times the FY2019 rate. However, FY2023 ranks only fourteenth-highest among the thirty-three approval cohorts in the published loan-level file. The FY2007 cohort charged off at 11.714% and FY2008 at 11.380%, both more than four times the FY2023 figure, and FY2001 sits at 2.514% — within one thousandth of a percentage point of FY2023. The period requiring explanation is therefore not the recent rise but the twelve years from FY2010 to FY2021, during which charge-off never exceeded 1.991%, the cleanest sustained stretch anywhere in the file. Two of those years, FY2020 and FY2021, carried direct federal payment support under Section 1112 of the CARES Act. Market benchmarks and loss assumptions formed inside that window describe an era rather than the programme. All figures are age-matched at a fixed 36 months from approval across 1,961,455 loans, approval years 1991 through 2026, from the SBA 7(a) FOIA extract dated 30 June 2026. A charge-off is a loan failing rather than a business closing.
Are SBA loan defaults actually rising?
Yes relative to the last decade, and no relative to the historical record. SBA 7(a) loans approved in FY2023 charged off at 2.515% within 36 months of approval, against 1.347% for FY2019. That is a real deterioration of roughly 1.87x, confirmed by a second cohort running 1.74x the same baseline at 24 months.
Viewed against the full published record the same figure reads differently. FY2023 is the fourteenth-highest of thirty-three cohorts. Thirteen approval years produced worse 36-month outcomes, and FY2001 — at 2.514% — sits within one thousandth of a percentage point of FY2023 without ever having been characterised as a credit event.
Both readings are accurate. The choice of baseline carries the entire interpretation.
How should cohort default rates be measured?
Every cohort must be measured at the same age and reported only once it has had the full observation window. Otherwise the comparison is a maturity gradient rather than a quality signal.
Cumulative charge-off is the most commonly published figure and the most misleading. A FY2015 cohort has had roughly eight more years to fail than a FY2023 cohort, so comparing their to-date rates measures elapsed time. The analysis here instead measures charge-off within a fixed 36 months of approval, and includes a cohort only where every loan in it has had that full window against the file date.
That constraint is why the 36-month series terminates at FY2023. Later approvals have not reached the horizon, and a near-zero figure on a current vintage is a statement about the calendar rather than about credit.
What is the SBA 7(a) charge-off rate by approval year?
Across the four published FOIA decade files, charge-off within 36 months of approval ranges from 0.638% to 11.714%.
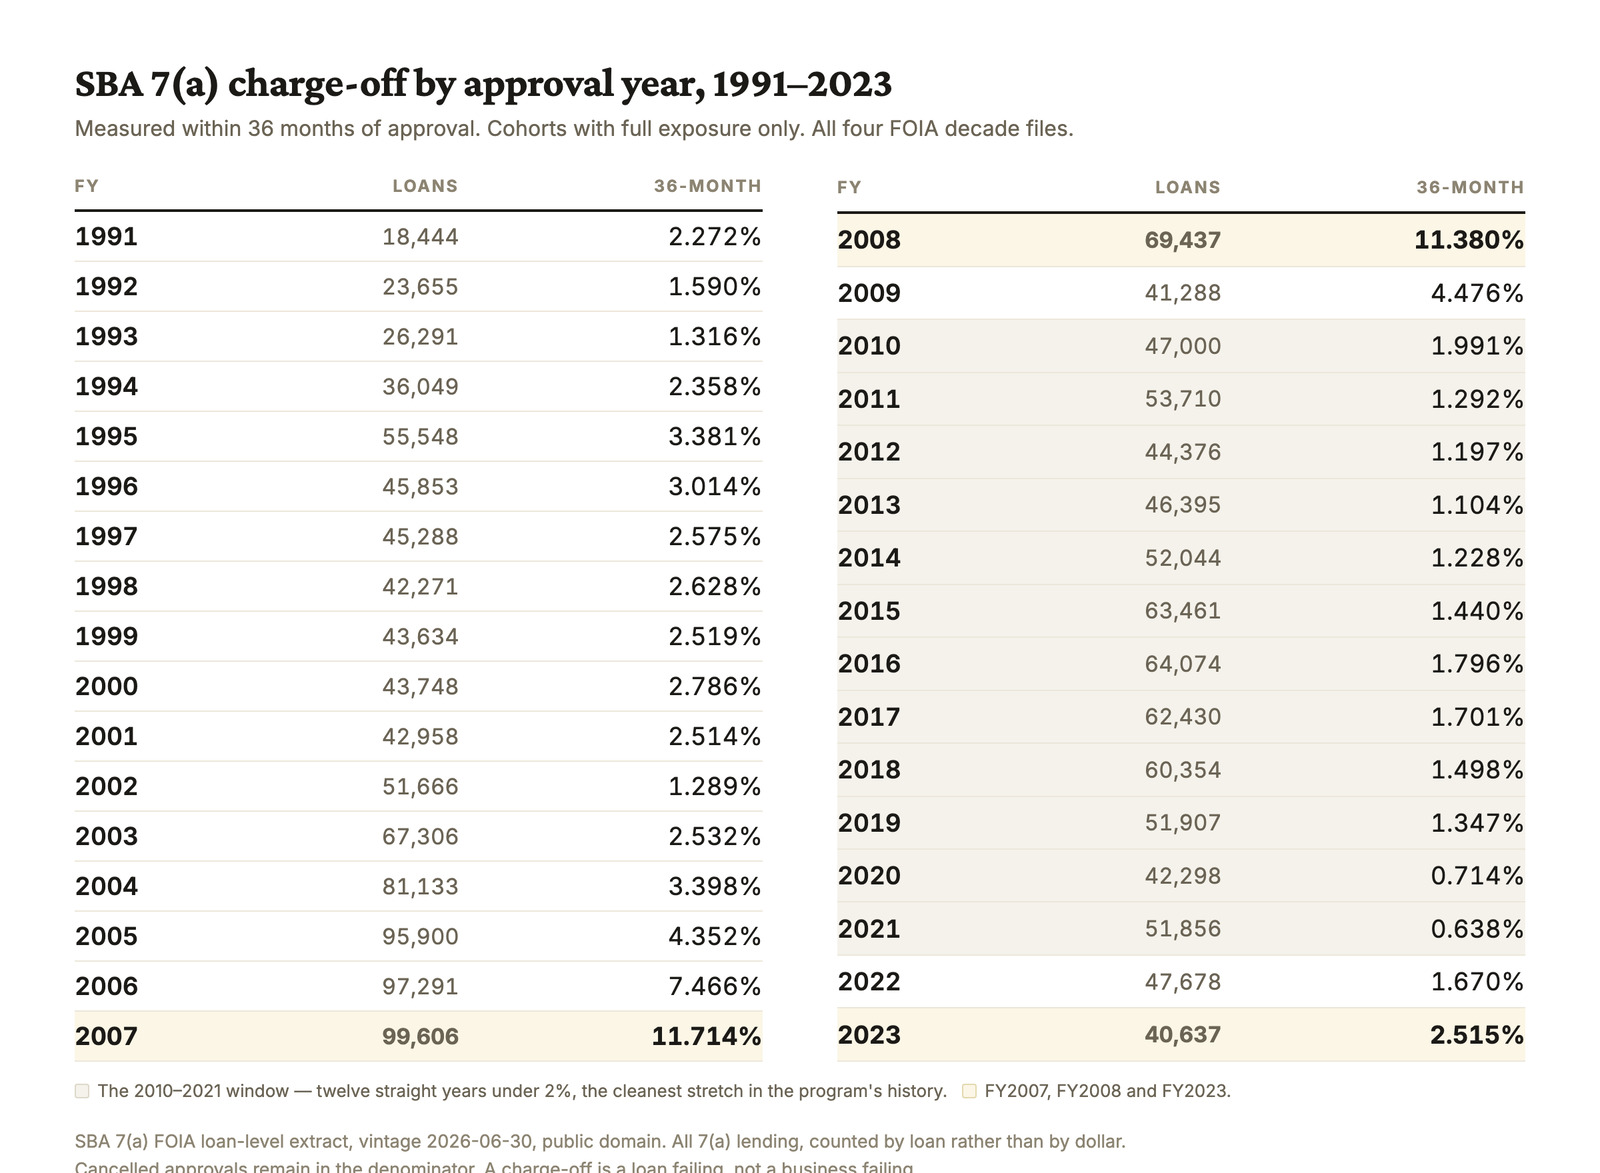
The FY2007 cohort spans 99,606 loans and 11,668 charge-offs inside three years. FY2023 spans 40,637 loans and 1,022 charge-offs.
Where does FY2023 rank historically?
Fourteenth of thirty-three. FY2007 charged off at 11.714% within 36 months — 4.7 times the FY2023 rate — and FY2008 at 11.380%. FY2006 reached 7.466% and FY2009 4.476%.
The pre-crisis years are not the only cohorts above FY2023. FY2004 (3.398%), FY1995 (3.381%), FY1996 (3.014%) and FY2000 (2.786%) all exceeded it, none during a recognised credit event.
A 2.5% 36-month charge-off rate is therefore not historically alarming. It sits close to the median of the pre-2010 distribution.
Why were the 2010s so unusually clean?
Between FY2010 and FY2021, charge-off ranged from 0.638% to 1.991% — twelve consecutive years below 2%, and cleaner than any comparable stretch in the file, which begins in 1991. The 1990s cohorts ranged from 1.316% to 3.381%; the 2000s from 1.289% to 11.714%.
The composition of that window explains part of it. It follows a credit event that removed weaker lenders and borrowers from the market, spans a decade of historically low policy rates, and terminates in two cohorts carrying direct federal payment support.
The practical consequence is that participants who entered the market after roughly 2012 formed their expectations inside an unrepresentative sample. Comparable benchmarks, loss assumptions and internal thresholds developed in that period describe an era rather than the programme.
Did the CARES Act distort the FY2020 and FY2021 cohorts?
Materially. Under Section 1112 of the CARES Act, the federal government made borrowers' principal and interest payments on covered 7(a) loans — payments made on the borrower's behalf rather than a deferral.
FY2020 and FY2021 charged off at 0.714% and 0.638%, the two lowest figures in the record. Those outcomes reflect a subsidy rather than underwriting.
This is the mechanism behind the widely circulated claim that SBA defaults have quadrupled. FY2023 against FY2021 is 3.94x. Against FY2019, an ordinary year with no subsidy, it is 1.87x. Against FY2007 it is 0.21x. All three ratios are arithmetically correct.
Was FY2022 or FY2023 the turning point?
FY2022. Charge-off moved from 0.638% in FY2021 to 1.670% in FY2022 — a 2.6x increase in a single approval year, and the largest year-over-year increase in the thirty-three-cohort series. The next largest is FY2003 at 1.96x.
Three conditions changed across that boundary simultaneously: §1112 support ended, benchmark rates rose sharply, and transaction pricing had not adjusted to either. FY2023 continued in the same direction rather than reverting, which distinguishes a regime change from a single anomalous cohort.
The debt-service effect is straightforward arithmetic. A $1,000,000 note amortised over ten years costs approximately $11,100 per month at 6% and approximately $13,775 at 11% — roughly $32,000 per year in additional debt service on an identical purchase price. Against a business generating $310,000 in seller's discretionary earnings, that is approximately 10% of owner cash flow moved to debt service before any operating variance.
Do the 24-month figures confirm the trend?
They do. At the 24-month horizon, where FY2024 has sufficient exposure to be reported, two consecutive cohorts run materially above the FY2019 baseline.
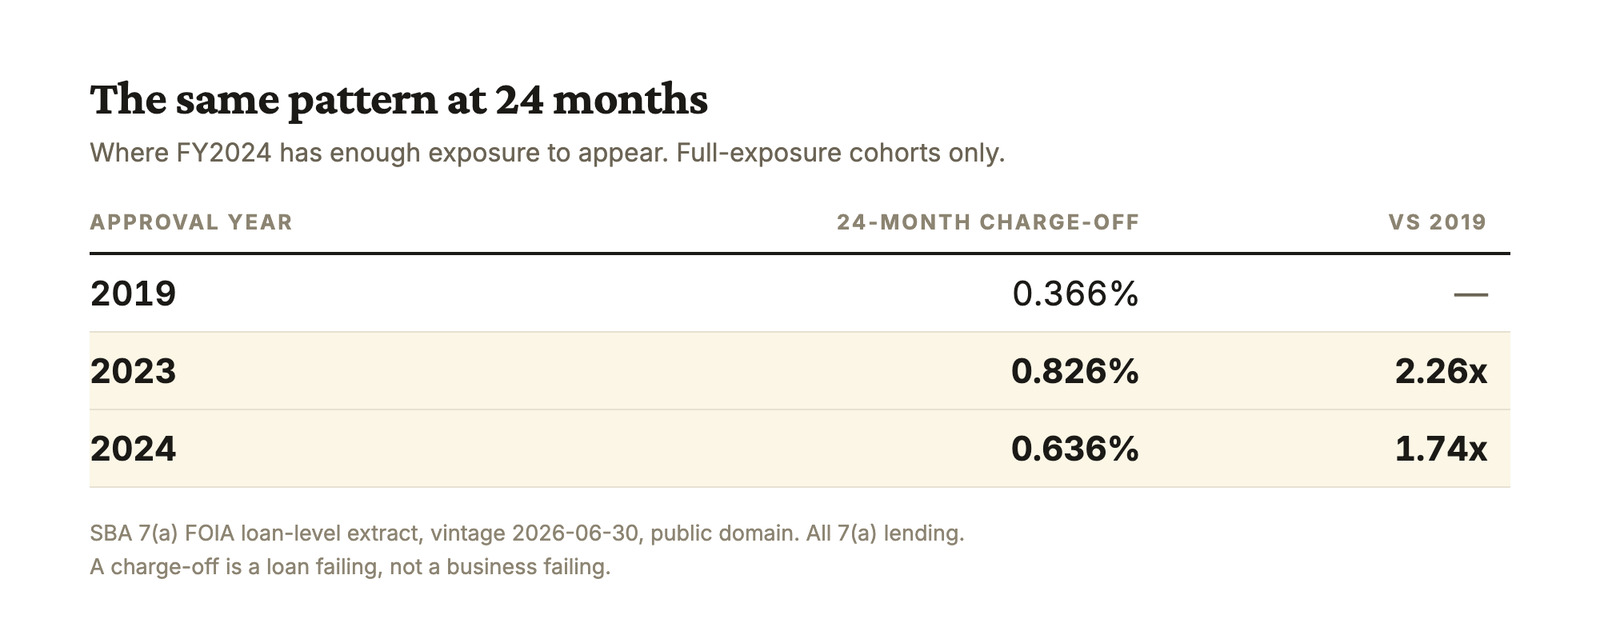
The direction of measurement error reinforces this rather than undermining it. The SBA records a charge-off after workout and liquidation, so recent cohorts are systematically understated relative to older ones even at matched age. FY2023's figure is more likely to be revised upward than downward.
Did the August 2023 rule changes cause this?
No on timing, and the question cannot yet be answered for later cohorts.
The FY2023 cohort reported here consists of approvals through approximately June 2023, the only ones with a full 36 months of exposure against the file date. Those approvals predate August 2023 entirely.
For cohorts falling after that date, a before-and-after comparison is inconclusive. Loans approved in the twelve months before show a 24-month charge-off rate of 0.80%; the eleven months after show 0.67%. That apparent improvement is not reliable — the earlier window reached its 24-month mark up to two years ago while the later window reached it within the last two months. Insufficient recording time and genuine improvement produce identical figures at this stage.
Two narrower observations survive. Only 84 lenders recorded a first-ever SBA approval after August 2023, writing 185 loans between them, so new entrants have not yet moved origination volume. And origination shifted toward the Preferred Lenders Program, up approximately 30%, which carried a 24-month charge-off rate of 0.43% against 1.07% for SBA Express across the same window.
Why doesn't due diligence identify vintage risk?
Because standard acquisition diligence examines the business, and vintage risk is a property of the transaction environment. Historical financial statements, tax returns, bank statements, payroll records and customer analyses all describe the target. None describe the cost of capital at signing, or the relationship between prevailing multiples and prevailing rates.
A quality of earnings analysis verifies that reported earnings are accurate. It does not evaluate whether the year in which a transaction is priced is a favourable one. DSCR thresholds test whether cash flow services the proposed debt at origination, not whether the cohort being entered is durable.
The cohort data implies that two buyers running identical processes and reaching identical conclusions can experience materially different outcomes on the basis of signing date alone.
What does this imply for transaction structure?
Vintage risk cannot be diligenced away, but it can be allocated. Where cohort conditions are deteriorating, the mechanisms that transfer risk back to the seller — seller notes, earnouts and holdbacks — carry more weight than in benign conditions, as does structure relative to headline price.
Three implications follow from the data rather than from opinion.
Baselines drawn from FY2020 or FY2021 understate normal loss. Those cohorts received direct federal payment support and cannot serve as a reference point.
Baselines drawn from FY2010 to FY2019 also understate it. That decade never exceeded 1.991%, against a pre-2010 record reaching 11.714%. A model fitted on the former is fitted on a period rather than a programme.
Current-vintage data is unreadable. FY2025 and FY2026 approvals will report near-zero charge-off for a further two to three years, which is why the timing of an acquisition is only measurable well after the decision has been made.
Methodology and limitations
Source. SBA 7(a) FOIA loan-level extract, file date 30 June 2026, public domain, retrieved from data.sba.gov. All four decade files — FY1991–FY1999, FY2000–FY2009, FY2010–FY2019, FY2020–present. 1,961,455 loans, approval years 1991 through 2026. Analysis run 3 August 2026.
Definition. A loan is counted as charged off within the window where LoanStatus is CHGOFF and the interval between ApprovalDate and ChargeOffDate is at or below the horizon — 1,096 days for 36 months, 730 for 24. Cohorts are grouped by ApprovalFY, the SBA fiscal year of approval, running October through September.
Full-exposure requirement. A cohort is reported only where every loan in it has had the complete window available against the file date. The 36-month series therefore terminates at FY2023 and covers approvals through approximately June of that fiscal year rather than the full year.
Denominator. All approvals in the cohort, including those recorded as cancelled and never disbursed. This understates every rate relative to a disbursed-only basis, and the effect applies across all cohorts.
Weighting. Loans are counted, not dollars. A $25,000 Express loan carries the same weight as a $5,000,000 note. Dollar-weighted loss would differ.
No controls applied. Figures are not adjusted for programme mix, loan size, geography or lender. The growth of SBA Express through the 2000s sits inside the series rather than being held constant, and some portion of the difference between decades reflects composition rather than underwriting. That portion is not estimated here.
A charge-off is a loan outcome, not a business outcome. The two are correlated but distinct. This analysis makes no claim about business survival rates, and does not use loan amount as a proxy for purchase price.
Restatement. The SBA revises historical records between file releases. All figures cite the 30 June 2026 vintage; figures drawn from other vintages will not reconcile exactly.
The analytical takeaway
The deterioration in recent SBA cohorts is real, confirmed across two consecutive approval years at matched age, and probably understated by recording lag. It is also modest against the historical record and unremarkable against the pre-2010 distribution.
The more consequential finding is the shape of the FY2010 to FY2021 window. Twelve consecutive years below 2% is the anomaly in this series, and it is the period during which most current market benchmarks, loss assumptions and expectations were formed. Recent cohorts are not departing from the programme's historical behaviour. They are returning to it.
This article is general information, not financial, legal, tax, or investment advice. Figures vary by deal, lender, and jurisdiction. Consult a qualified CPA, transaction advisor, or attorney before relying on any analysis.

Avery Hastings, CPA
Founder, Acquidex • CPA • Tokyo, Japan
Avery Hastings is a CPA based in Tokyo, Japan and the founder of Acquidex. She focuses on helping buyers evaluate small-business deals with clear cash-flow logic, realistic downside analysis, and practical diligence frameworks.
Keep up with Avery →Sources
Keep Reading
- Adjusted EBITDA Is the One Number in a Deal No One Can Prove7 min read read
Adjusted EBITDA — or its Main Street cousin, SDE — sets the asking price, anchors the negotiation, and sizes the loan. It is also the only number in the deal that is an argument rather than a measurement. A CPA reads the add-back schedule.
- Do Overconfident Buyers Pay More for Small Businesses?18 min read read
A landmark study on Forbes 500 CEOs shows overconfident executives have 65% higher odds of making an acquisition, and the market reacts 90 basis points more negatively to their deals. The mechanism transfers to private-market buyers. The measurement does not. Here is what a buyer-side test would actually look like.
- The Four Risks That Decide Whether an Acquisition Works11 min read read
Most SMB and lower-middle-market deals don't fail on strategy. They fail because four risks — overstated cash flow, customer concentration, owner dependency, and aggressive leverage — were each judged manageable in isolation, then compounded after close.