


Key Insight
Short SBA 7(a) loans approved in September, the last month of the SBA's fiscal year, charged off more often than the rest of their fiscal year in every year from FY2010 to FY2017: eight out of eight. Pooled across the period, 9.6% of September approvals among loans with terms of seven years or less charged off, against 8.2% for January, the lowest month. The effect is modest, a few tenths of a percentage point to about two points in a given year, and the consistency is what makes it notable. It is not a loan-mix effect: the pattern holds within regular term loans in all eight years and within revolving credit lines in six of eight, and credit lines make up the same share of approvals in September (54.8%) as in the rest of the year (54.4%). It is not obviously a year-end rush either: September approval volume, about 8.5% of the year, is no higher than August's. The mechanism is unknown. For borrowers, the finding is not a reason to delay a sound deal. For lenders, it is a reason to check their own September book.
The short answer: yes, slightly and consistently. Short SBA loans approved in September went bad more often than the rest of their year, every year from 2010 to 2017. It isn't a mix of loan types and it isn't a volume spike. Nobody has a tested explanation yet.
How much more often do September loans default?
A little, and every year. Across short SBA loans approved from 2010 to 2017, September had the highest charge-off rate of any month.
| Approved in | Share of approvals | Charged off |
|---|---|---|
| January | 6.8% | 8.2% |
| February | 7.3% | 8.9% |
| March | 9.2% | 8.6% |
| April | 9.3% | 8.2% |
| May | 9.3% | 8.5% |
| June | 9.0% | 9.1% |
| July | 8.4% | 9.3% |
| August | 8.6% | 9.2% |
| September | 8.5% | 9.6% |
| October | 7.7% | 8.7% |
| November | 7.5% | 8.6% |
| December | 8.4% | 8.4% |
These are SBA 7(a) loans with terms of seven years or less, approved in fiscal years 2010 to 2017 and since either paid in full or charged off: 208,886 loans in all. Longer loans, which mostly finance real estate, are excluded because they behave differently and default far less often.
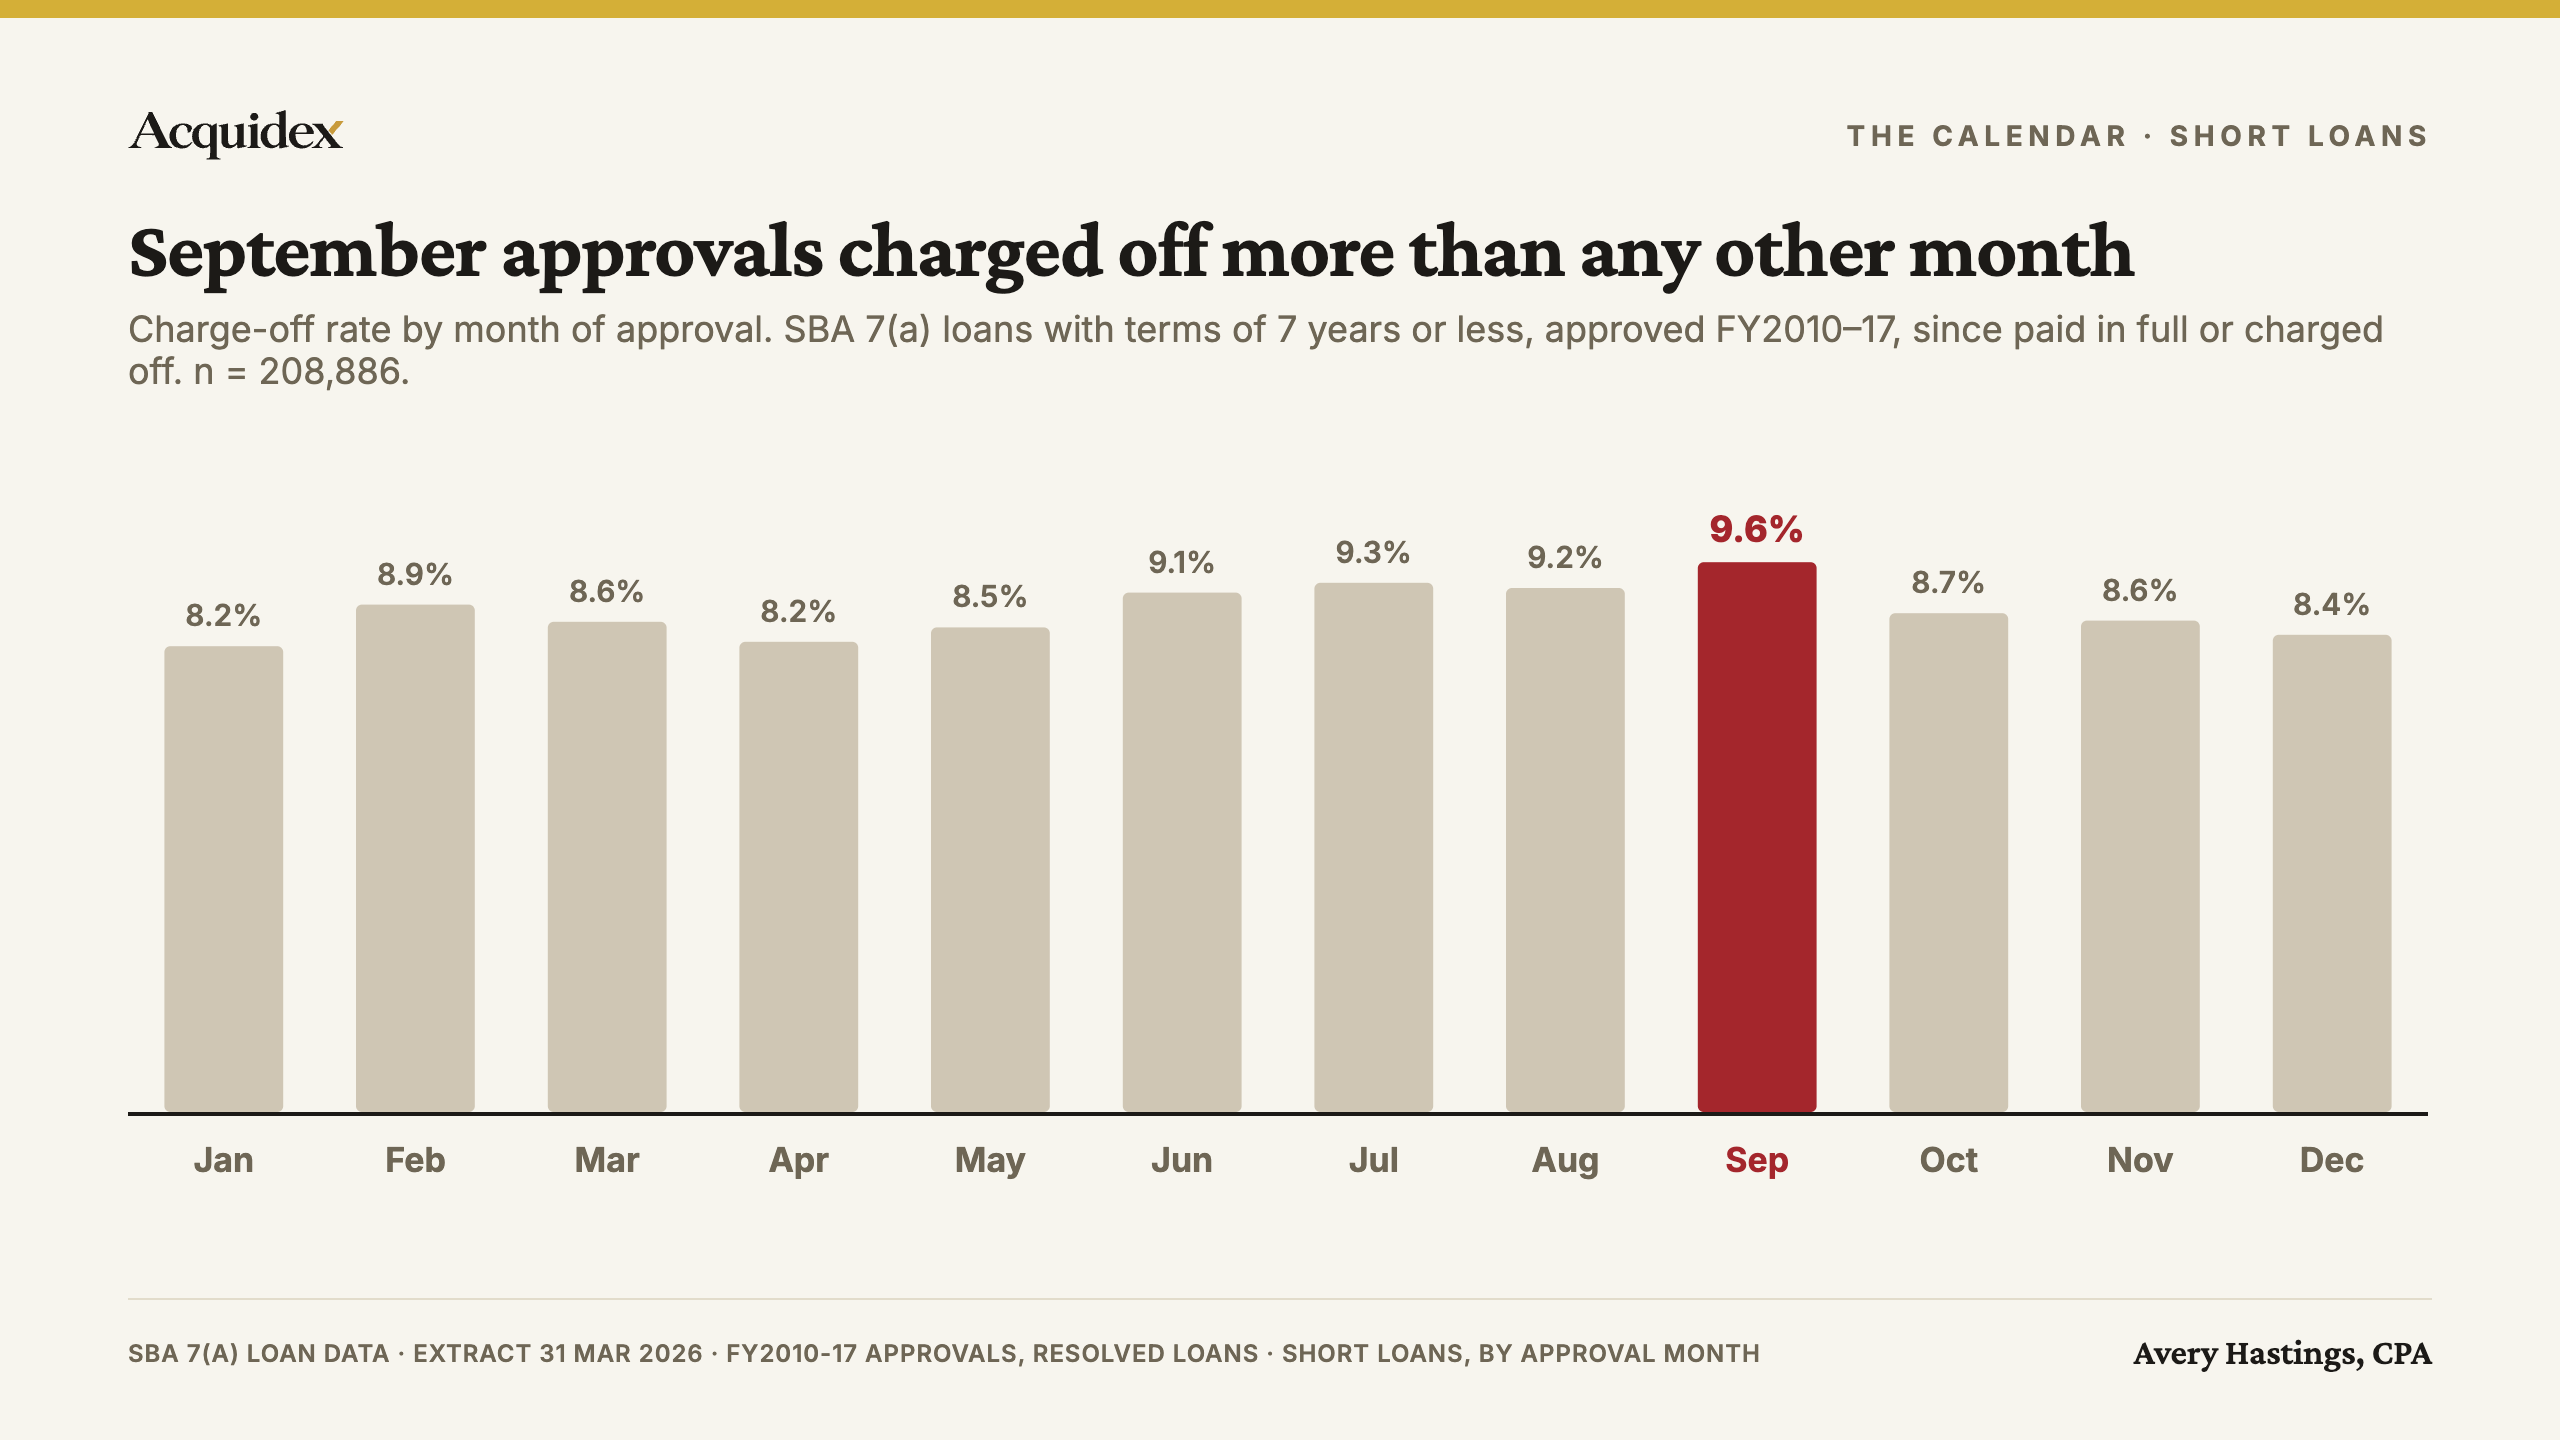
The difference is small. The summer months run high too, and the whole range from January to September is under a point and a half. If this were one year of data, it would be noise. What makes it worth writing about is the next table.
Does it happen every year?
Yes. In every fiscal year from 2010 to 2017, short loans approved in September charged off more often than short loans approved in the rest of that same year.
| SBA fiscal year | September approvals | Rest of year | September higher? |
|---|---|---|---|
| FY2010 | 9.53% | 9.13% | Yes |
| FY2011 | 7.90% | 7.61% | Yes |
| FY2012 | 7.73% | 7.43% | Yes |
| FY2013 | 9.32% | 7.43% | Yes |
| FY2014 | 8.64% | 8.19% | Yes |
| FY2015 | 9.46% | 8.93% | Yes |
| FY2016 | 11.12% | 9.45% | Yes |
| FY2017 | 12.13% | 10.64% | Yes |
Eight out of eight. If September were really no different from any other month, you would expect it to land above the rest of its year about half the time. Landing above it eight times running would happen by chance less than one time in two hundred. In three of those years, FY2013, FY2016 and FY2017, the gap was about a point and a half or more.
Is September part of a bigger seasonal pattern?
It sits at the top of one. Look back at the monthly table and a shape appears: loans approved from June to September all ran above average, and loans approved from December to April mostly ran below it.
Pooled together, short loans approved in the four months from June to September charged off at roughly 9.3%. Loans approved in the five months from December to April charged off at roughly 8.4%. That is about 10% more often for summer approvals, with September the highest month inside the higher season.
That matters for how to read September. It may not be a September problem at all, but the peak of a summer-approval pattern that nobody has explained either. Businesses apply for credit for different reasons at different times of year. A loan approved in January often funds a planned season ahead. A loan approved in late summer may be funding the tail of a season that did not go to plan. That is a hypothesis, not a finding, and it is the most useful thing to test next.
Is it just a different mix of loans?
It does not look that way, and this was the first thing worth ruling out.
SBA loans come in two broad kinds that behave very differently. Revolving credit lines default less than short term loans overall, and a shift in how many of each get approved in September could create a pattern like this on its own. It didn't. The effect shows up within each kind separately:
- Term loans: September approvals charged off more than the rest of their year in all eight years, 12.72% against 11.27% pooled.
- Credit lines: September approvals charged off more in six of the eight years, 7.06% against 6.52% pooled.
And the mix itself barely moves. Credit lines were 54.8% of September's short-loan approvals and 54.4% of the rest of the year's. The same kind of mix problem once made a much bigger finding look stronger than it was, which is why it is worth checking first; the story of that is in Do Marshmallows Predict Bad Loans?
Is it a year-end rush?
That is the obvious guess, and the data does not support the simple version.
The SBA's fiscal year ends on September 30. It would be natural to imagine lenders pushing borderline loans through before the deadline, so that September fills up with weaker credits. If that were happening at scale, September would be unusually busy.
It isn't. September accounted for about 8.5% of the year's short-loan approvals, slightly below August at 8.6% and well below the spring peak of around 9.3%. Whatever makes September loans a little worse, it is not simply that there are more of them.
That doesn't rule out a year-end effect entirely. The quality of loans approved in September could differ without their number changing. But it rules out the easy explanation, and anyone who tells you confidently why September is different is guessing.
So why does it happen?
Honestly, nobody has a tested answer, including me.
There are plausible stories, and they are worth listing precisely because none of them has been checked:
- Something about how loans are processed near the SBA's fiscal year-end could change which applications get approved in September, without changing how many.
- Businesses that apply for credit in late summer could differ from businesses that apply in winter, for reasons tied to their own seasonal cash cycles.
- The effect could interact with the broader seasonal pattern in the table above, where approvals from June to September all run above average.
Each of those could be tested with more data. None has been. Until one is, the honest description is a consistent, modest pattern with no known cause.
What should borrowers and lenders do with it?
If you are a borrower, nothing about the calendar is your fault, and nothing about it should change a good deal. The effect describes loans in aggregate, not your loan. It is small. Delaying a sound acquisition by a month to avoid September would cost you more than the calendar ever could. Focus on the things that actually move risk, starting with whether the deal covers its debt; see the debt service coverage SBA lenders actually require.
If you are closing around the fiscal year-end, the date that matters more is October 1, when the SBA's updated lending rules take effect for loans that get their loan number on or after that date. That is covered in the SOP 50 10 8.1 change-of-ownership rules.
If you are a lender, you can check this on your own book in an afternoon. Split your approvals by month and compare September with the rest of each year. If your September loans look different, the next question is why, and your credit files can answer it in a way the public data cannot.
- Split approvals by month for every year you have outcomes on, not just the last one.
- Compare September with the rest of the same year, not with September of other years. Year-to-year swings are larger than the September effect.
- Separate credit lines from term loans before comparing. The two default at different rates, and a shift in mix can fake a pattern.
- Count only resolved loans, or use a fixed window from funding, so recent vintages don't look artificially good.
- If September looks different, pull the files. Your credit memos can say why in a way public data never will.
If you are a buyer, the more useful timing signal in the same data is not the approval month. It is how fast a business first drew on its credit line: what it means when a business draws its SBA credit line right away.

Avery Hastings, CPA
Founder, Acquidex • CPA • Tokyo, Japan
Avery Hastings is a CPA based in Tokyo, Japan and the founder of Acquidex. She focuses on helping buyers evaluate small-business deals with clear cash-flow logic, realistic downside analysis, and practical diligence frameworks.
Keep up with Avery →Sources
No external sources are cited in this article.
Keep Reading
- What Does It Mean When a Business Draws Its SBA Credit Line Right Away?7 min read read
- The $10 Million SBA Limit: What It Buys, and What It Doesn't11 min read read
- What Is a Cash Proof? The SBA Test That Reconciles Your Bank Statements12 min read read
- SOP 50 10 8.1: The New SBA Rules for Buying a Business (October 1, 2026)13 min read read
- SBA 504 Loans for Buying a Business: How They Work (and How They Differ from 7(a))10 min read read
- What to Do When Your Acquisition Deal Misses DSCR (Recovery Structures)11 min read read