


Key Insight
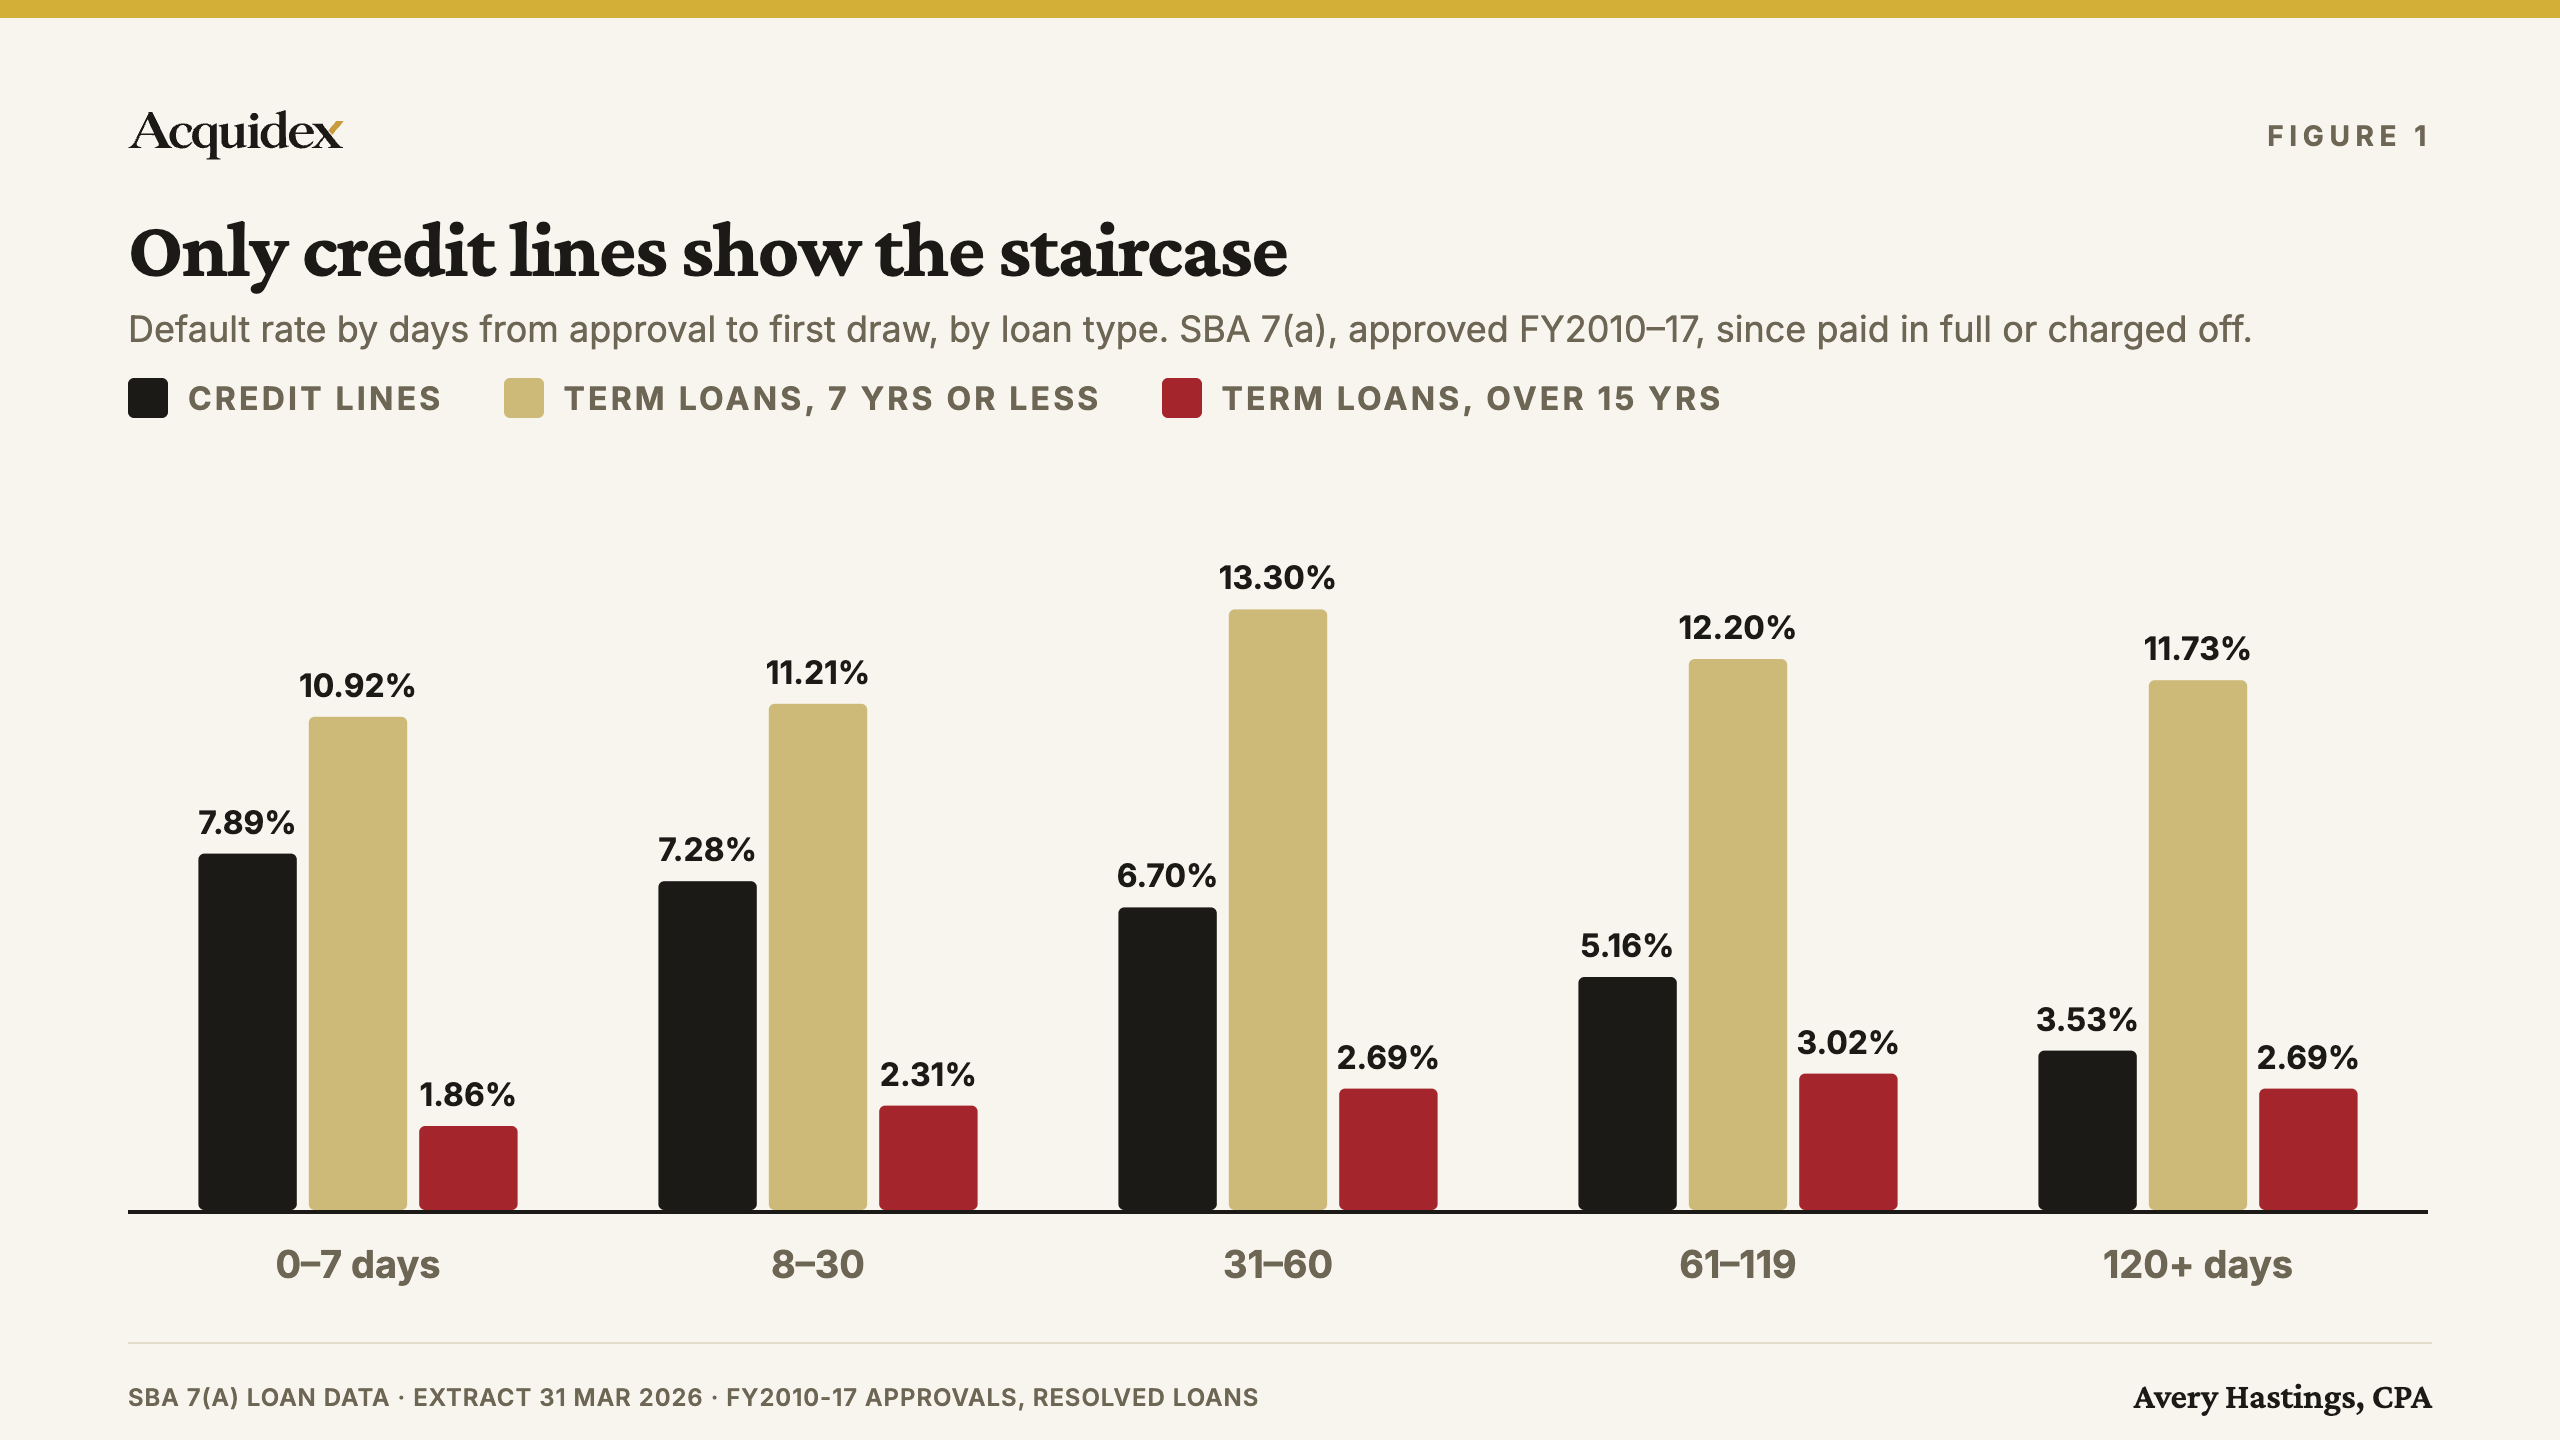
Across 114,756 SBA 7(a) revolving lines of credit approved between FY2010 and FY2017 and since paid in full or charged off, borrowers who first drew on the line within seven days of approval charged off at 7.89%, against 3.53% for borrowers whose first draw came 120 days or more after approval: a ratio of 2.2 to 1. The charge-off rate falls at every interval of delay (7.89%, 7.28%, 6.70%, 5.16%, 3.53%), and the gap persists in every approval year, line size, approval month and industry sector examined, widening to 2.5 to 1 after standardising for approval year and line size. The same measure carries little signal for term loans. Among term loans of seven years or less, early and late first disbursements default at similar rates (10.92% and 11.73%); among term loans longer than fifteen years, a late first disbursement is associated with more defaults, not fewer (2.69% against 1.86%). The association is observational. The most plausible reading is that first-draw timing on a discretionary credit line reveals the borrower's liquidity at approval, which the loan file does not otherwise record.
Does the timing of the first draw on an SBA credit line predict default?
Yes, strongly. Among SBA 7(a) revolving credit lines approved between FY2010 and FY2017, lines first drawn within seven days of approval charged off at 7.89%, against 3.53% for lines first drawn 120 days or more after approval. The rate declines at every interval of delay, and the pattern holds across every subgroup examined.
A revolving line of credit is unusual among SBA products because approval and use are separate events. The lender approves a limit; the borrower then decides when, and whether, to draw on it. Every SBA loan record carries both dates, the approval date and the first disbursement date, and the distance between them measures a choice the borrower made without any expectation that it would be observed.
Most borrowers draw quickly. Of the 114,756 resolved credit lines in the sample, 39.3% were first drawn within a week of approval, and the median gap was 17 days.
| Days from approval to first draw | Lines | Charge-offs | Charge-off rate |
|---|---|---|---|
| 0 to 7 | 45,081 | 3,555 | 7.89% |
| 8 to 30 | 22,512 | 1,639 | 7.28% |
| 31 to 60 | 13,947 | 934 | 6.70% |
| 61 to 119 | 11,566 | 597 | 5.16% |
| 120 or more | 21,650 | 764 | 3.53% |
| All credit lines | 114,756 | 7,489 | 6.53% |
The gradient is monotonic: each additional interval of delay is associated with a lower charge-off rate. Within the first week, the effect is already visible. Lines drawn the same day they were approved charged off at 8.08%, against 7.34% for lines first drawn one to seven days later.
The pattern resembles the delay-of-gratification studies begun at Stanford by Walter Mischel and colleagues, in which children offered one treat immediately or two after a wait were followed into adolescence (Mischel, Ebbesen and Zeiss, 1972; Shoda, Mischel and Peake, 1990). The comparison is illustrative rather than evidential. A large conceptual replication found the original associations substantially weaker once family background and early ability were controlled (Watts, Duncan and Quan, 2018), a reminder that a delay can proxy for circumstances rather than character. The same caution applies here.
Why does the same measure say little about term loans?
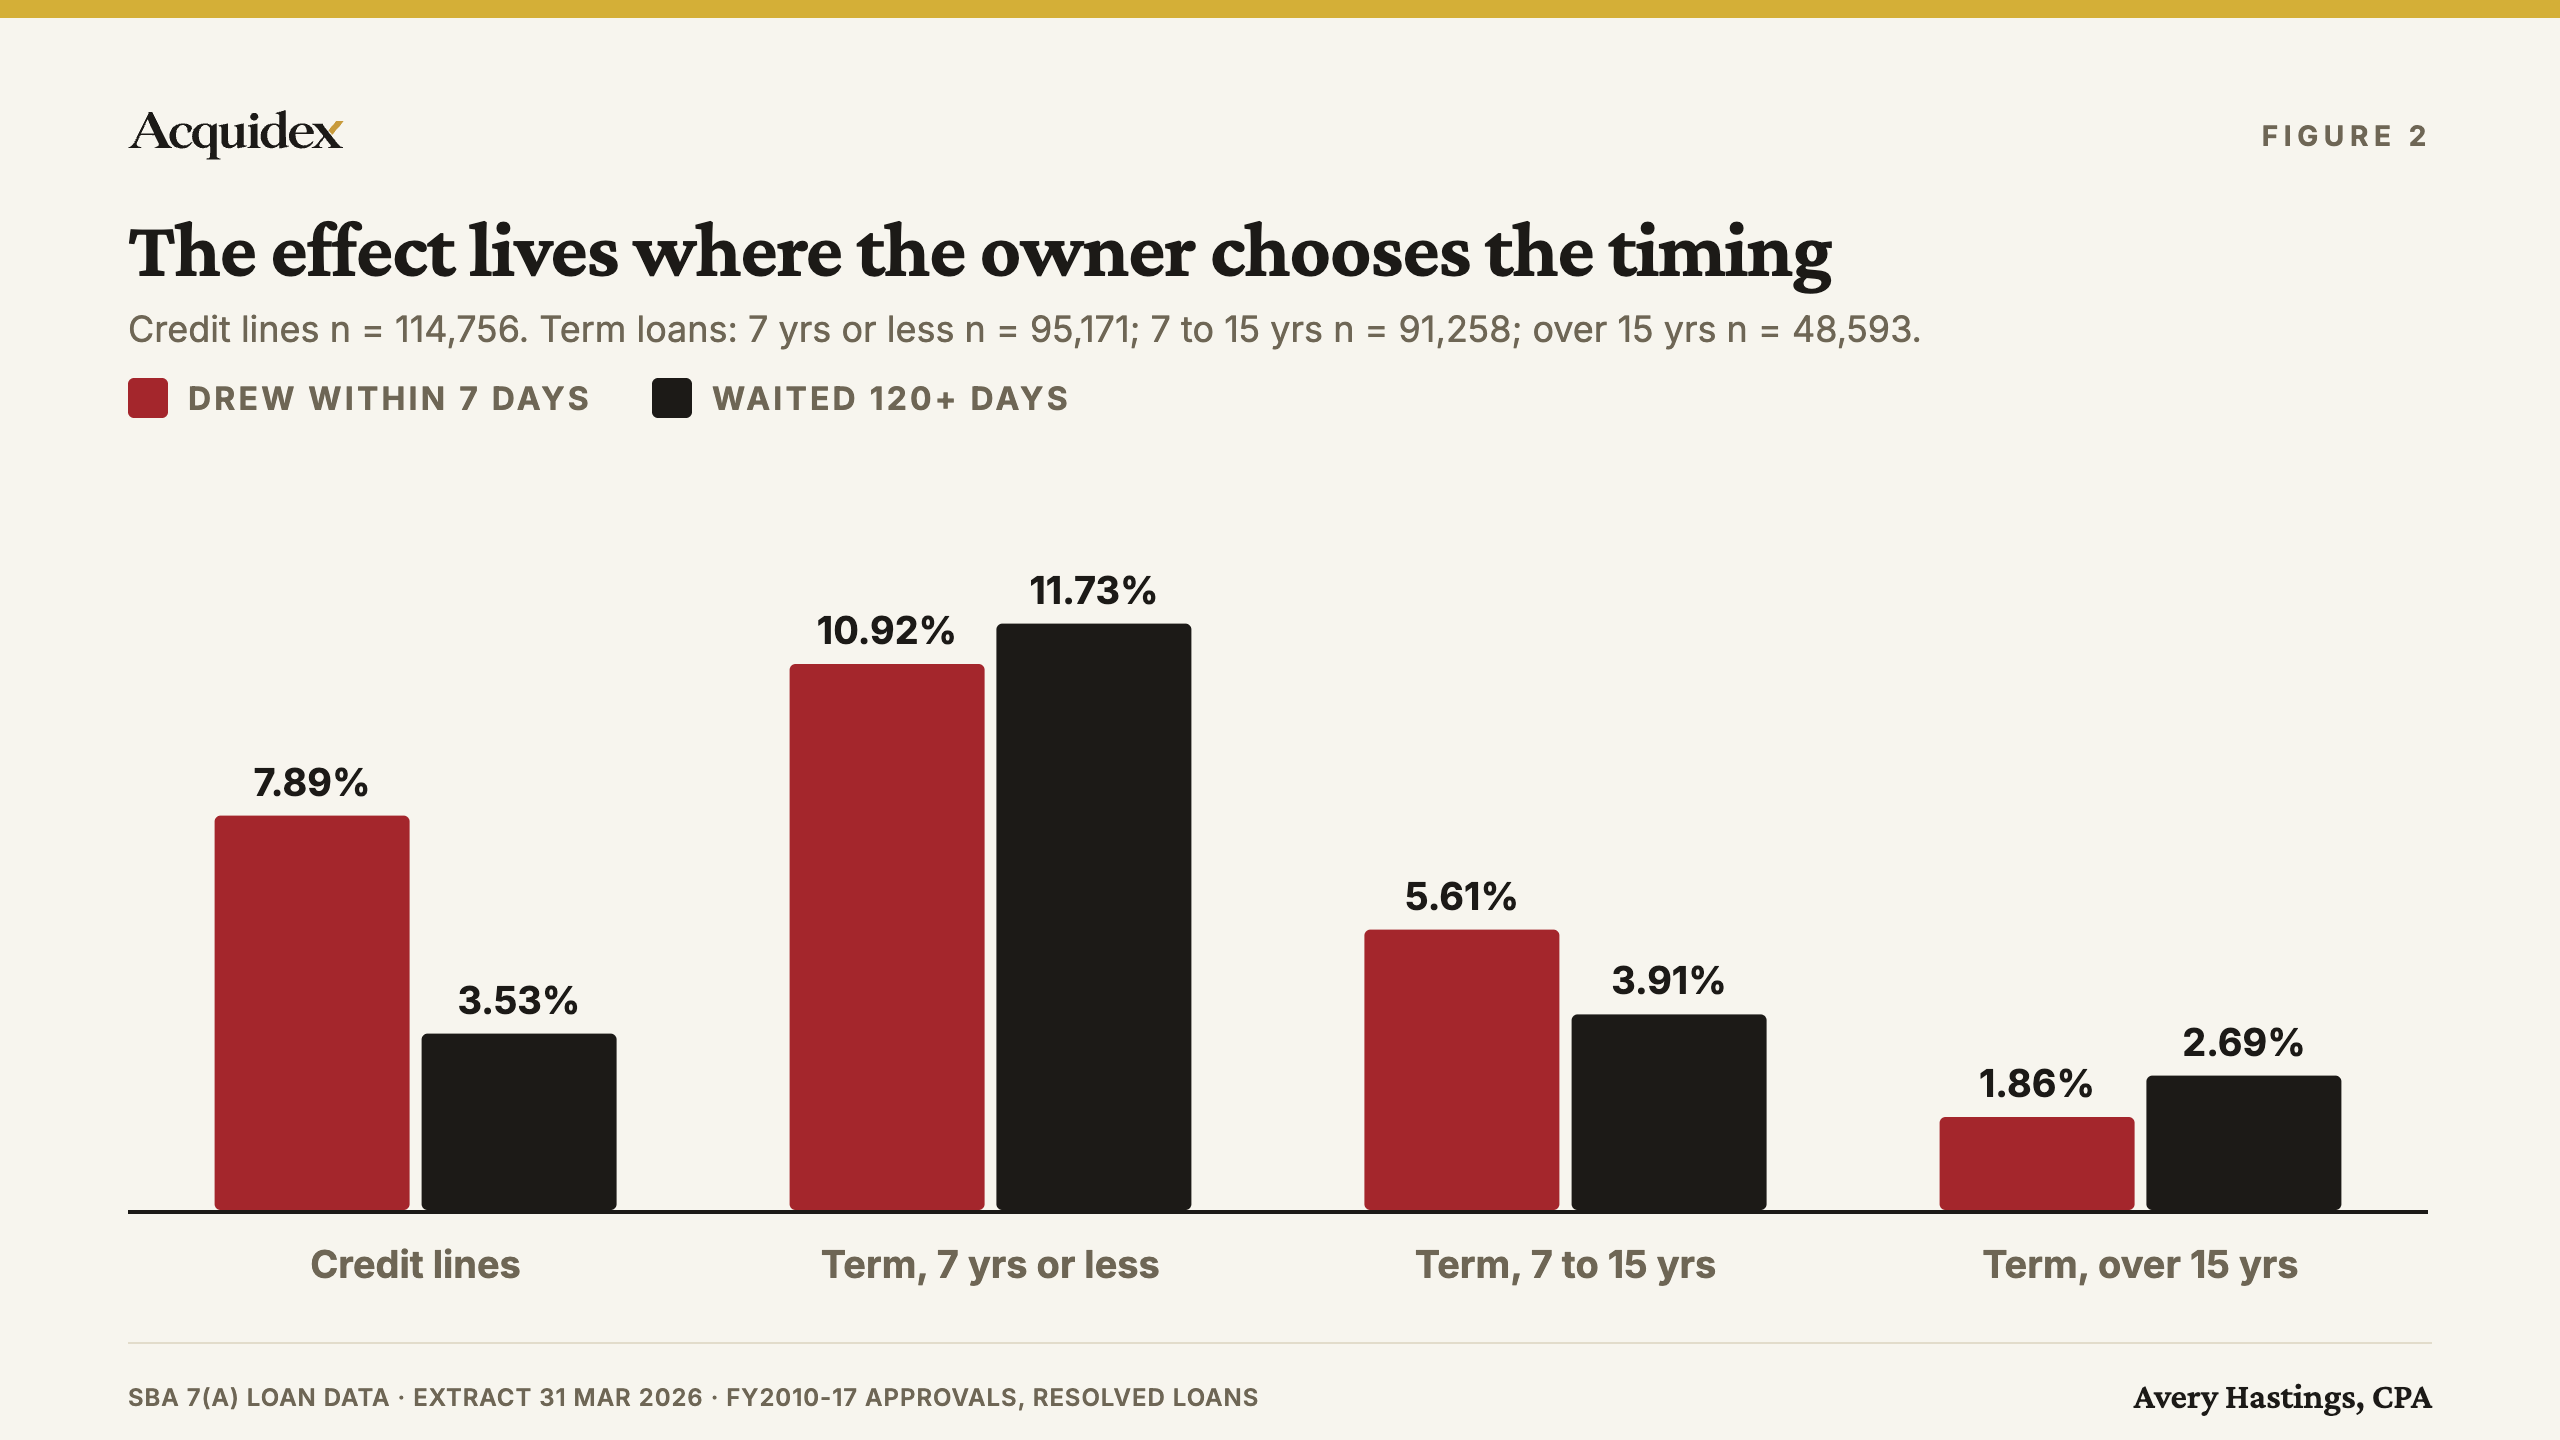
Because a term loan's timing is rarely the borrower's choice. Term loans usually fund when a transaction closes, so the first disbursement date reflects the closing schedule, the seller and the lender. Among term loans of seven years or less, loans funded within a week and loans funded after 120 days default at similar rates: 10.92% and 11.73%.
| Loan type | Drawn within 7 days | Drawn 120+ days | Ratio |
|---|---|---|---|
| Credit lines | 7.89% (n = 45,081) | 3.53% (n = 21,650) | 2.23 |
| Term loans, 7 years or less | 10.92% (n = 51,510) | 11.73% (n = 6,105) | 0.93 |
| Term loans, over 7 to 15 years | 5.61% (n = 39,934) | 3.91% (n = 7,770) | 1.43 |
| Term loans, over 15 years | 1.86% (n = 20,718) | 2.69% (n = 4,161) | 0.69 |
The mid-length band shows a moderate positive association. The longest band reverses it. Loans with terms above fifteen years typically finance real estate, construction or large acquisitions, where a long delay between approval and funding is more likely to reflect a stalled project than a well-capitalised borrower. The difference in that band is statistically significant (z of approximately 3.1) but rests on 112 charge-offs in the late group, the thinnest cell in the analysis.
The composition trap
An analysis that pools all SBA loans produces a misleading result. Across all loans with terms of seven years or less, early draws charge off at 9.53% and late draws at 5.35%, a ratio of 1.8 that appears to describe a general borrower behaviour. It largely does not. Across the full sample, credit lines make up 54.6% of late-drawing loans but only 28.7% of early-drawing loans, and credit lines default less than short term loans (6.53% against 11.39%). Much of the pooled gap is therefore the mix of loan types rather than the timing of draws within a loan type.
The same artefact affects industry comparisons. Construction and trades loans are 54.7% credit lines and professional services 47.1%, against 16.2% for restaurants and hotels. A pooled analysis consequently shows a strong timing effect in trades and a weak one in restaurants. Within credit lines, both show a strong effect. Any analysis of SBA draw timing needs to separate revolving lines from term loans before drawing conclusions about industries, programmes or borrowers.
Is the credit-line effect explained by vintage, size, season, industry or a head start?
No. The association survives every control tested, and becomes stronger after joint standardisation for approval year and line size. The table summarises the checks, all within credit lines.
| Alternative explanation | Test | Result |
|---|---|---|
| Loan-type mix | Separate credit lines from term loans | Effect concentrated in credit lines (2.23 to 1); absent in short term loans |
| Approval year | Each fiscal year, 2010 to 2017 | Present in all 8 years; ratios 1.91 to 2.91 |
| Line size | Five bands, under $25,000 to over $250,000 | Present in all 5; ratios 1.59 to 3.10 |
| Approval month | Each calendar month | Present in all 12; ratios 1.91 to 2.86 |
| Industry sector | Five NAICS sectors | Present in all 5; ratios 1.93 to 2.67 |
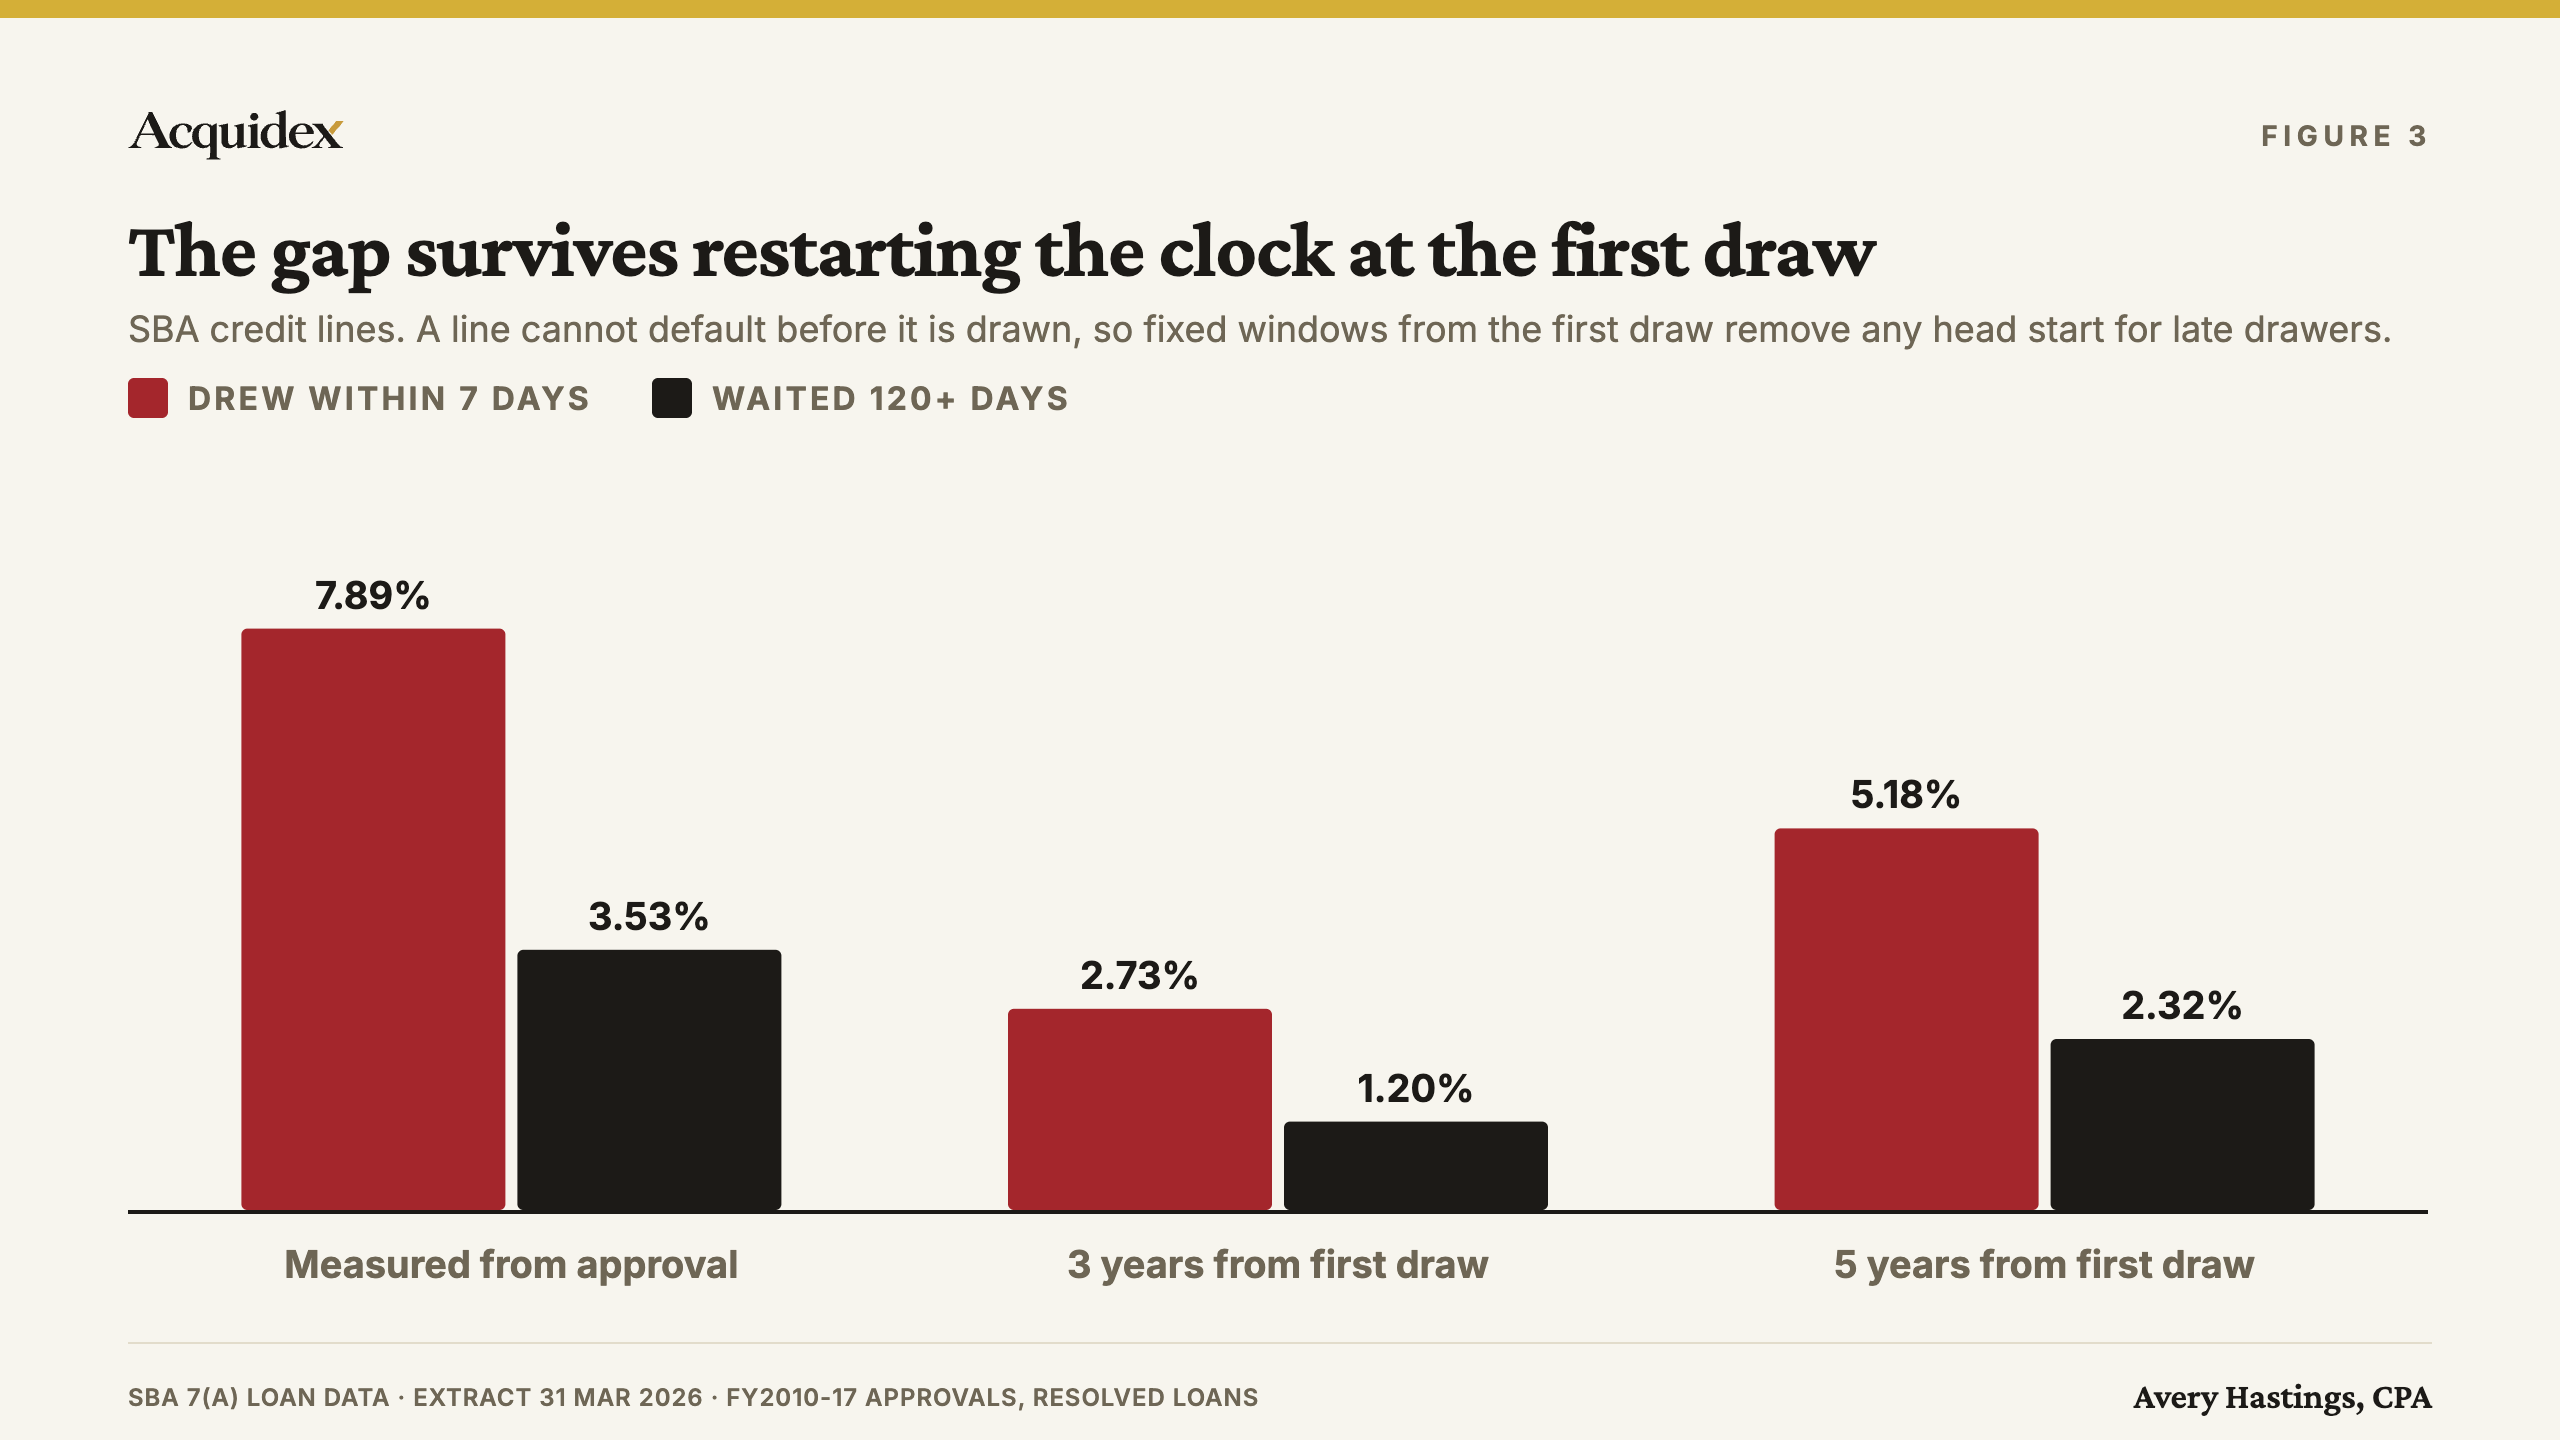
| Head start | Fixed windows from first draw | 2.27 to 1 at three years; 2.23 to 1 at five years |
| Low utilisation | Loss as share of line, among failed lines | 94% (early) against 93% (late) |
| Year and size together | Direct standardisation | Late-draw rate 3.53% to 3.17%; ratio rises to 2.48 |
The head-start test addresses the most obvious mechanical objection. A line cannot default before it is drawn, so a borrower who waits 120 days is protected from charge-off for that period if outcomes are measured from approval. Measuring instead over fixed three- and five-year windows from the first draw removes that advantage. The ratio is essentially unchanged.
The utilisation check addresses a second objection: that borrowers who wait simply use less of the line, leaving less to lose. The public data does not record balances over a line's life, but for charged-off lines it records the loss. Among failed lines, the loss equalled a median of 94% of the approved limit for early drawers and 93% for late drawers. Late drawers that failed were not failing on small balances. The data cannot show utilisation among lines that were repaid, which remains a limitation.
The seasonal check matters because many small businesses have predictable cash troughs. Borrowers approved in winter do draw faster: 44.7% of January approvals were first drawn within a week, against 35.9% in May. But the association holds within every month, and standardising the late-drawing group to the early group's monthly mix moves its rate from 3.53% to 3.51%.
Does the pattern hold across industries?
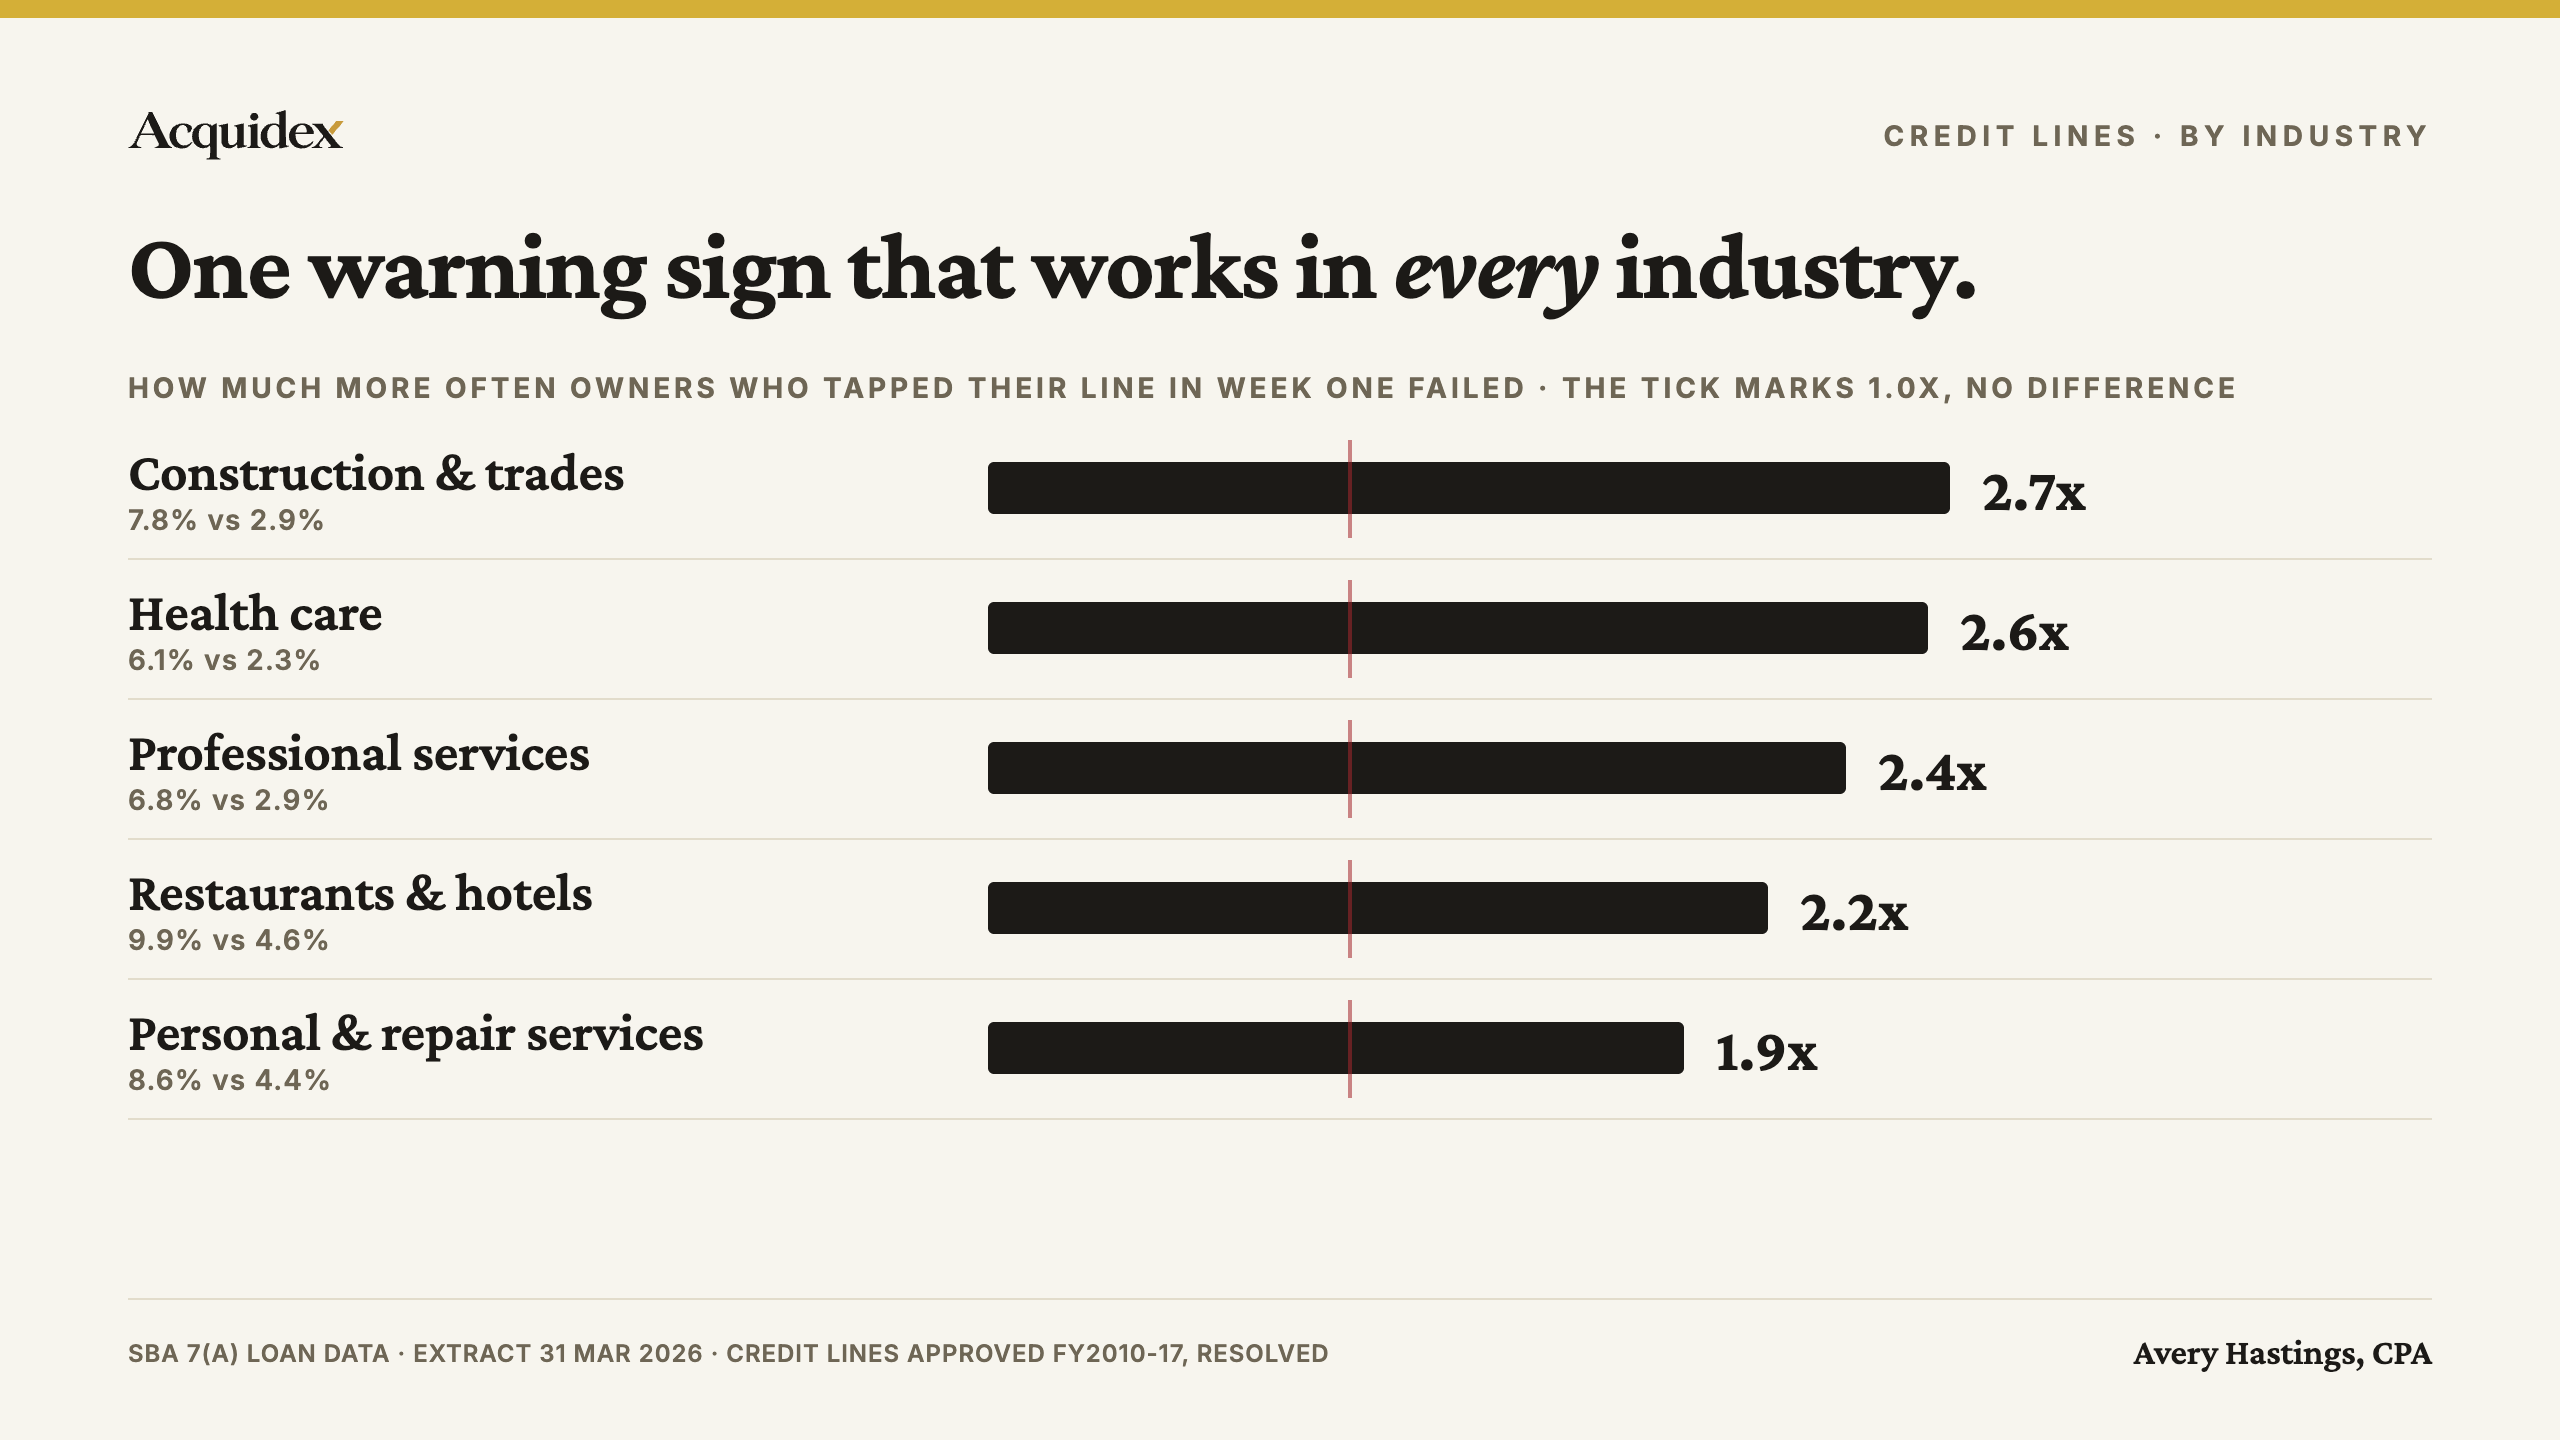
Yes. Within credit lines, early first draws are associated with charge-off rates roughly two to nearly three times higher in every sector examined, including restaurants, the sector where a timing signal was most expected to be swamped by structural risk.
| Sector (credit lines only) | Drawn within 7 days | Drawn 120+ days | Ratio |
|---|---|---|---|
| Construction and trades | 7.78% (630 / 8,093) | 2.91% (104 / 3,570) | 2.67 |
| Health care | 6.11% (206 / 3,369) | 2.34% (43 / 1,836) | 2.61 |
| Professional services | 6.82% (443 / 6,496) | 2.86% (101 / 3,532) | 2.38 |
| Restaurants and hotels | 9.94% (262 / 2,635) | 4.59% (67 / 1,459) | 2.17 |
| Personal and repair services | 8.57% (265 / 3,094) | 4.44% (68 / 1,533) | 1.93 |
The hardest test: sit-down restaurants. Restaurants carry some of the highest structural risk in the SBA file, and plenty of patient, well-run restaurants still fail. If a timing signal were going to disappear anywhere, it would be here. Among SBA credit lines to sit-down restaurants, lines first drawn within a week of approval charged off at 11.01% (145 of 1,317). Lines left undrawn for four months or more charged off at 3.96% (29 of 732). The gap is one of the widest in the file.
At the level of individual industries, residential remodelers (10.51% against 4.23%) and lawyers (6.35% against 2.72%) show the same pattern. Several industries, including plumbing contractors, beauty salons and fitness centres, have too few late-drawing credit lines or charge-offs to support a reliable estimate and are not reported individually. Only groups with at least 200 loans and ten charge-offs on each side are shown.
The breadth of the result is its most practical feature. Most diligence indicators are sector-specific: a margin that is healthy in professional services would be alarming in wholesale, and the add-backs that deserve scrutiny differ by industry (see which add-backs SBA lenders actually accept). First-draw timing on a credit line behaves consistently across sectors.
Is the effect stable over time?
Broadly, yes. The ratio between early and late first draws stayed between roughly 1.9 and 2.9 in every approval year from FY2010 to FY2017, and early drawers charged off more often than late drawers in every year without exception.
| Approval year | Drawn within 7 days | Drawn 120+ days | Ratio |
|---|---|---|---|
| FY2010 | 6.79% | 2.60% | 2.61 |
| FY2011 | 7.11% | 2.44% | 2.91 |
| FY2012 | 6.85% | 2.88% | 2.38 |
| FY2013 | 6.98% | 2.78% | 2.51 |
| FY2014 | 7.57% | 3.40% | 2.22 |
| FY2015 | 9.17% | 3.65% | 2.51 |
| FY2016 | 9.46% | 4.42% | 2.14 |
| FY2017 | 8.23% | 4.32% | 1.91 |
The two most recent years show the smallest ratios, and it is tempting to read that as the signal fading. The data does not support that reading yet. The sample includes only lines that have already been paid in full or charged off, and many lines approved in FY2016 and FY2017 are still open and therefore excluded. The recent-year figures describe the lines that ended soonest, a population that is not directly comparable with older, fully seasoned years. Whether the effect is weakening can only be settled as more of those lines resolve.
Does the size of the line matter?
The gap appears at every line size, but it is not uniform. It is widest for lines between $25,000 and $250,000 and narrowest for the largest lines.
| Line size | Drawn within 7 days | Drawn 120+ days | Ratio |
|---|---|---|---|
| Under $25,000 | 9.26% (n = 18,578) | 4.58% (n = 9,979) | 2.02 |
| $25,000 to $50,000 | 8.31% (n = 11,575) | 2.96% (n = 5,341) | 2.81 |
| $50,000 to $100,000 | 7.10% (n = 6,883) | 2.69% (n = 3,377) | 2.64 |
| $100,000 to $250,000 | 5.17% (n = 5,207) | 1.66% (n = 1,922) | 3.10 |
| Over $250,000 | 4.02% (n = 2,838) | 2.52% (n = 1,031) | 1.59 |
Two patterns stand out. Smaller lines default more often in both groups, consistent with smaller and younger borrowers. And the ratio is lowest for the largest lines, where the late-drawing group still defaults at 2.52%. One plausible reading, untested here, is that large lines more often go to established businesses that open a line well ahead of a planned need, so a delay tells a lender less. For lines below $250,000, which are most SBA credit lines, the timing signal is at its strongest.
Do SBA loans approved in September default more often?
Yes, consistently, for reasons that are not yet clear. Short SBA loans approved in September charged off more often than loans approved in the rest of the same fiscal year in each of the eight years from FY2010 to FY2017. Pooled across years, 9.62% of September approvals charged off, against 8.15% for January, the lowest month.
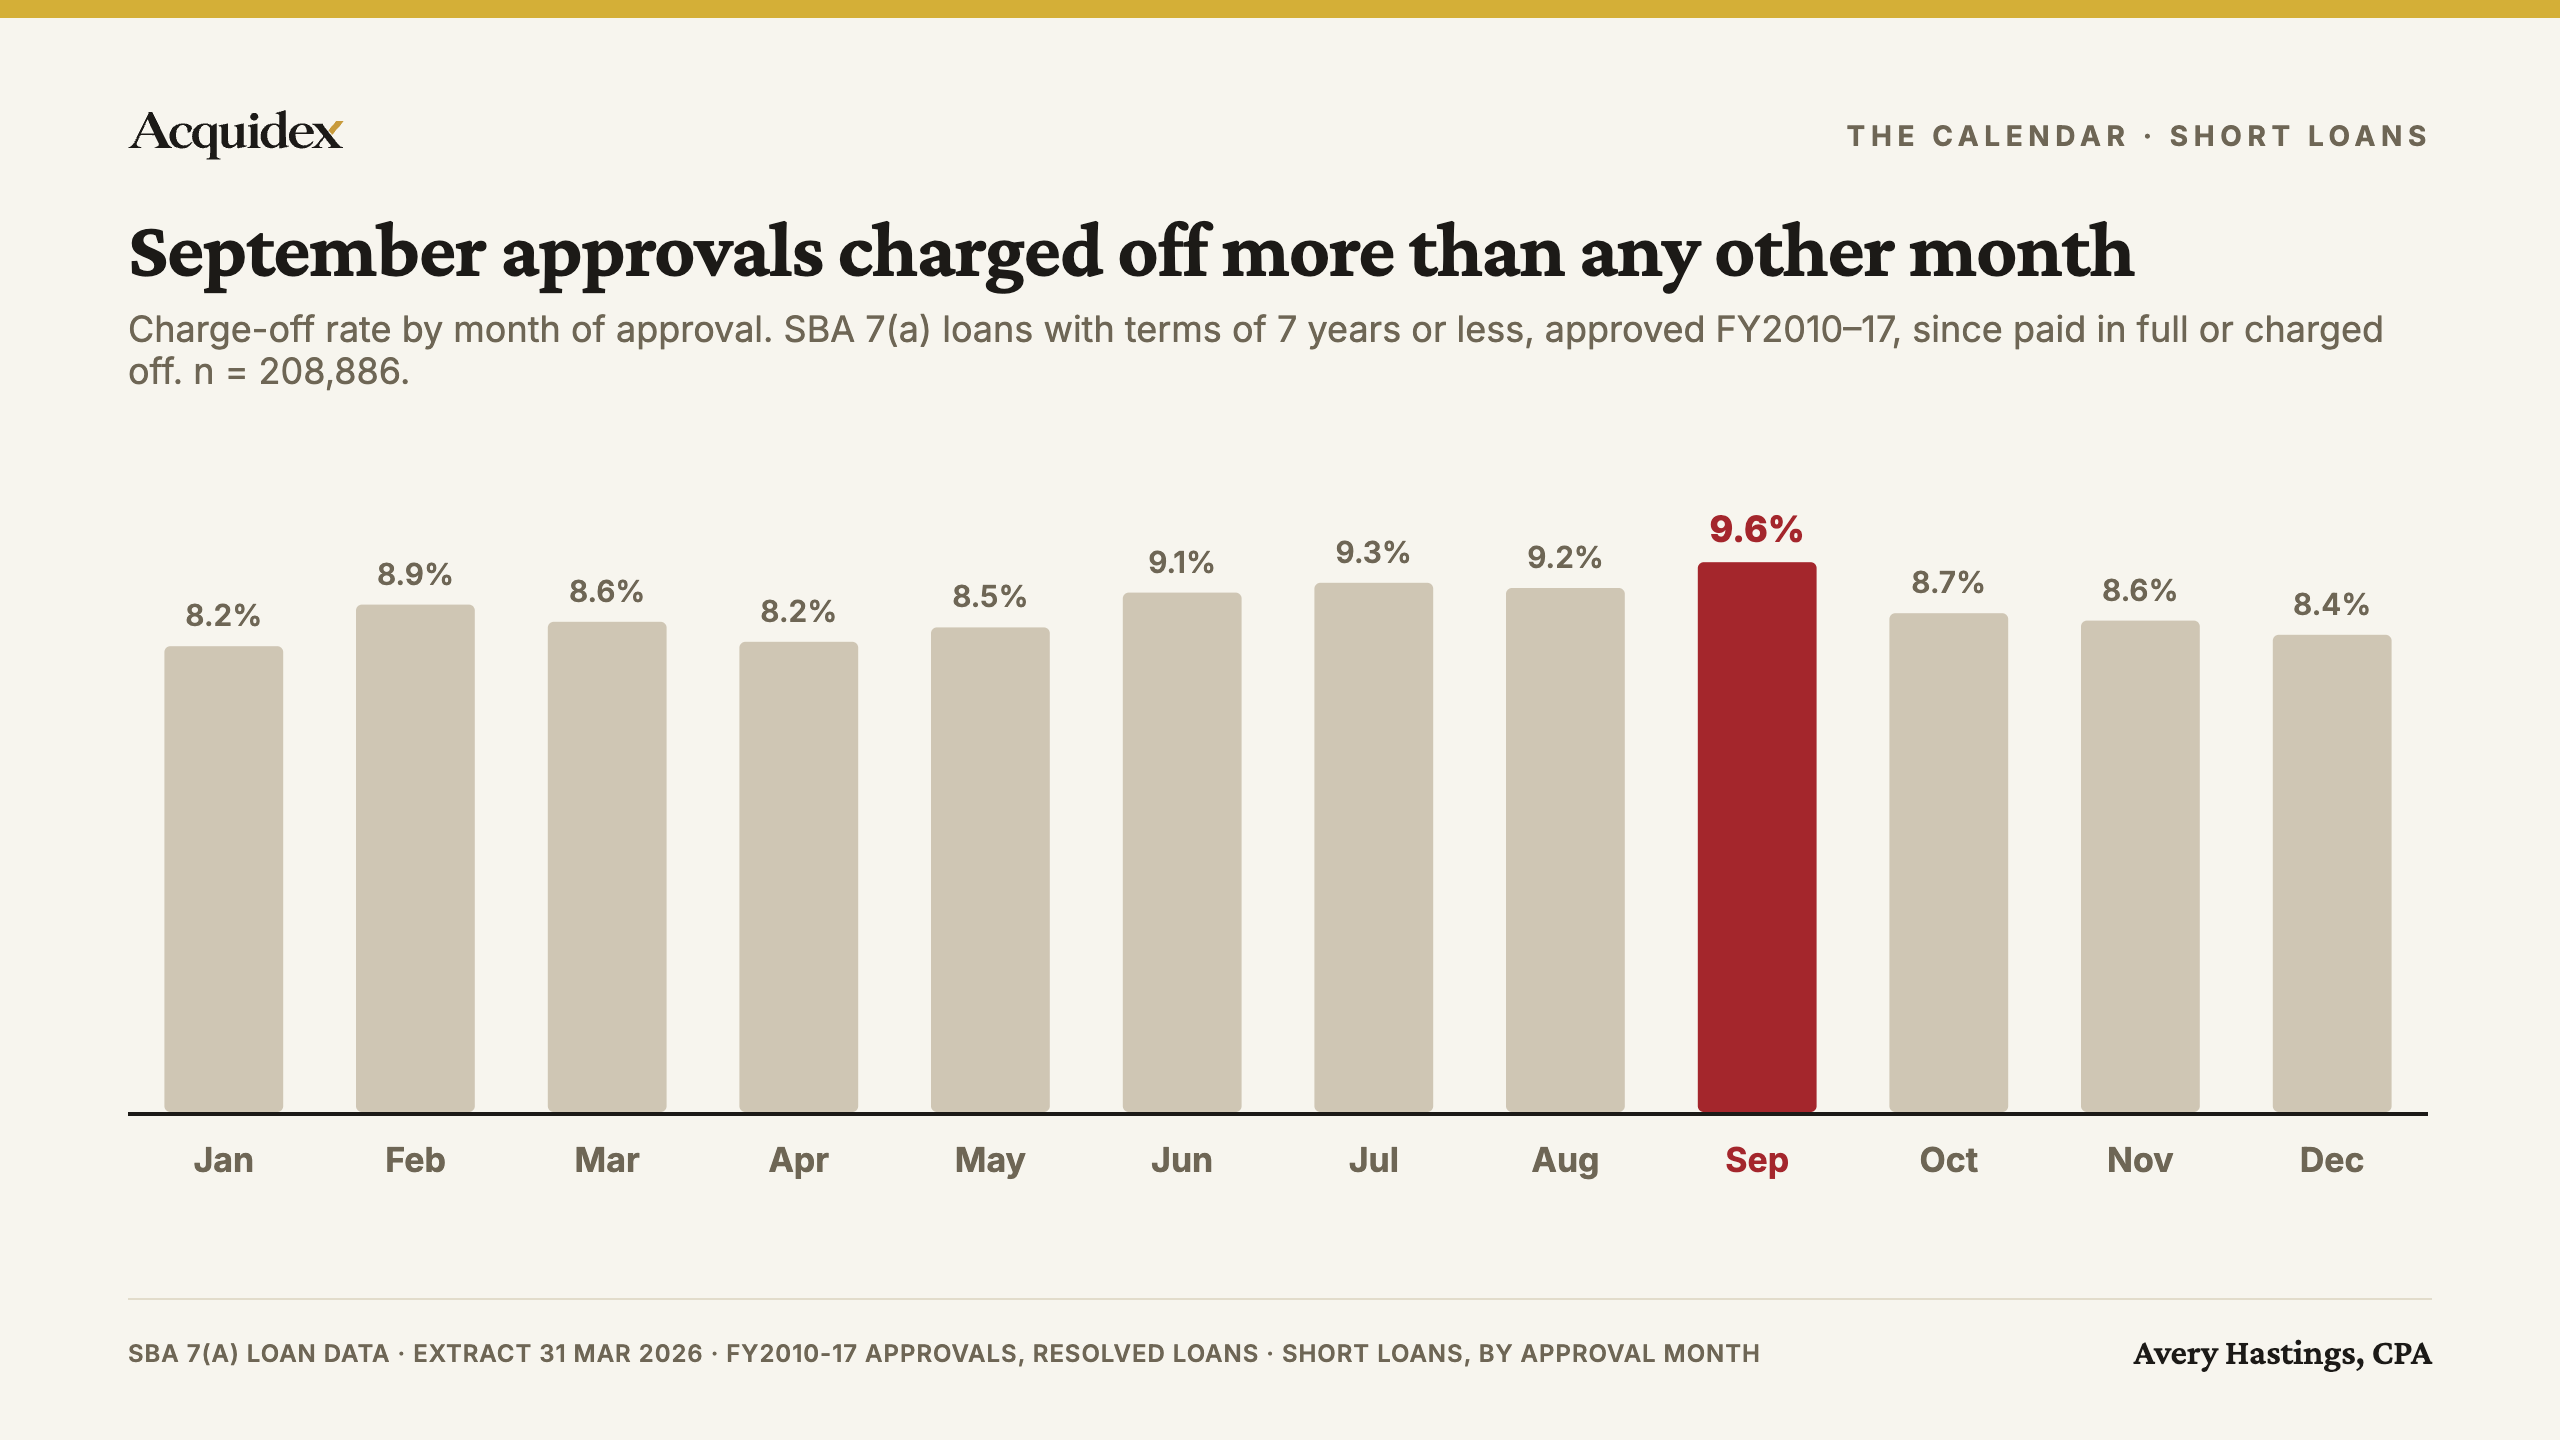
The pattern is not a product of loan-type mix. It holds within term loans in all eight years (12.72% against 11.27%) and within credit lines in six of eight (7.06% against 6.52%), and the share of credit lines among September approvals (54.8%) is almost identical to the rest of the year (54.4%). September is the final month of the SBA's fiscal year, but September approval volume is not materially higher than August's, which argues against a simple year-end rush in origination volume. The mechanism is unknown. The pattern, and the questions it raises for lenders and borrowers, is set out in Do SBA loans approved in September default more often?
How can buyers, lenders and advisers use this?
The underlying data is public. The SBA's 7(a) and 504 FOIA release at data.sba.gov provides loan-level records for all 7(a) and 504 loans approved since fiscal year 1991, in four files by fiscal-year range, updated quarterly. Records include the borrower's name and address, the approval and first disbursement dates, whether the loan is a revolving line, and its status. A step-by-step walkthrough is in how to look up a business's SBA loan history before you buy it.
Buyers evaluating an acquisition target can search the files by the target's legal name and zip code. Three findings merit a question to the seller: an SBA loan that was not disclosed, a prior loan that was charged off, and a credit line first drawn within days of approval. A single loan is weak evidence on its own, and name matching can produce false positives, so each finding is a prompt for inquiry rather than a conclusion. The check fits alongside the rest of a buyer's screen for deal-breaking red flags.
Lenders hold both dates for every line in their servicing systems. The interval requires no new data collection and is, unlike most underwriting inputs, produced by the borrower without awareness that it is informative. Whether it adds predictive value beyond a lender's existing models, including the debt service coverage lenders require, is a question each lender can test on its own book.
Advisers preparing a business for sale can anticipate the question. A seller whose credit line was drawn immediately after approval will be better served by a documented explanation, such as a planned seasonal inventory purchase, than by leaving a buyer to infer distress. What an early draw can and cannot tell a buyer is covered in what it means when a business draws its SBA credit line right away.
What to check in the FOIA file
The files are large but manageable. The FY2010 to FY2019 file used here has roughly 546,000 rows, within the row limit of a standard spreadsheet, though the FY2020 to present file should be checked before opening. The fields that matter for a diligence lookup, using the column names as they appear in the file:
| Field | What it records | What to look for |
|---|---|---|
borrname, borrzip | Borrower's legal name and zip code | Search both. Trade names often differ from the legal entity that borrowed. |
grossapproval | Amount approved | Loans or lines the seller has not disclosed, or amounts that differ from what was. |
revolverstatus | Whether the loan is a revolving line of credit | The timing signal described here applies to lines. |
approvaldate, firstdisbursementdate | When the loan was approved, and when money first went out | On a line, a first draw within about a week of approval. |
terminmonths | Loan term in months | On terms above 180 months, an unusually long gap before funding. |
loanstatus | Current status | Any charge-off (CHGOFF). Note that paid-in-full appears as P I F, with spaces. |
Two cautions apply. Name matching is imperfect: a common business name can return unrelated borrowers, and a match should be confirmed with the seller before it is treated as a finding. And a clean record is not a clean bill of health; it shows only SBA-backed borrowing, not bank loans, merchant cash advances or seller financing that sit outside the programme.
What are the limitations of this analysis?
The relationship is observational. The analysis establishes that first-draw timing on SBA credit lines is strongly associated with charge-off, and that the association is not explained by the variables tested. It does not establish that delaying a draw reduces risk. The most plausible common cause, the borrower's liquidity at approval, is not recorded in the data.
The finding is specific to revolving credit lines. For term loans the relationship is weak, absent or reversed depending on term, and pooled analyses of all loan types overstate it.
Utilisation over the life of a line is not observed. Loss amounts show that failed lines were nearly fully drawn in both groups, but utilisation among repaid lines is unknown.
The long-term reversal rests on 112 charge-offs among late-funded loans with terms over fifteen years.
A charge-off is a loan failure, not necessarily a business closure. The data covers SBA-backed lending only; acquisitions financed with cash or seller notes are not visible.
The analysis uses the extract dated 31 March 2026. The SBA has since published an extract dated 30 June 2026; historical records are occasionally restated between releases, and figures may move slightly on the newer extract.
Methodology
Source. SBA 7(a) FOIA loan-level file covering FY2010 to FY2019, extract dated 31 March 2026, from data.sba.gov.
Population. Loans approved in FY2010 to FY2017 whose status is paid in full or charged off, with a valid approval date and a first disbursement date on or after approval: 349,778 loans, of which 114,756 are revolving credit lines (flagged in the file's revolver status field). Loans that were cancelled, are still current, or were never disbursed are excluded.
Definitions. Days to first draw is the first disbursement date minus the approval date. Early draws are 0 to 7 days; late draws are 120 days or more. Term bands use the loan's stated term: 7 years or less (84 months or fewer), over 7 to 15 years, and over 15 years (more than 180 months). The charge-off rate is charged-off loans divided by resolved loans. Sectors are two-digit NAICS codes; industry examples merge the 2012 and 2017 NAICS code revisions where codes changed.
Tests. Differences in rates are assessed with two-proportion z-tests. Standardisation reweights the late-draw group to the early-draw group's joint distribution of approval year and line size (or approval month). The head-start test counts only charge-offs occurring within fixed windows of three and five years after the first draw. Groups with fewer than 200 loans or fewer than ten charge-offs on either side are not reported.
Data handling. The loan status field in this extract contains spaced values (for example, "P I F" for paid in full); whitespace is removed before classification. Analysis scripts are published so the figures can be reproduced or disputed.
References. Mischel, W., Ebbesen, E. B., and Zeiss, A. R. (1972). Cognitive and attentional mechanisms in delay of gratification. Journal of Personality and Social Psychology, 21(2), 204 to 218. Shoda, Y., Mischel, W., and Peake, P. K. (1990). Predicting adolescent cognitive and self-regulatory competencies from preschool delay of gratification. Developmental Psychology, 26(6), 978 to 986. Watts, T. W., Duncan, G. J., and Quan, H. (2018). Revisiting the marshmallow test: A conceptual replication investigating links between early delay of gratification and later outcomes. Psychological Science, 29(7), 1159 to 1177.

Avery Hastings, CPA
Founder, Acquidex • CPA • Tokyo, Japan
Avery Hastings is a CPA based in Tokyo, Japan and the founder of Acquidex. She focuses on helping buyers evaluate small-business deals with clear cash-flow logic, realistic downside analysis, and practical diligence frameworks.
Keep up with Avery →Sources
Keep Reading
- Adjusted EBITDA Is the One Number in a Deal No One Can Prove7 min read read
Adjusted EBITDA — or its Main Street cousin, SDE — sets the asking price, anchors the negotiation, and sizes the loan. It is also the only number in the deal that is an argument rather than a measurement. A CPA reads the add-back schedule.
- Are SBA Loan Defaults Actually Rising? Charge-Off by Approval Year, 1991–202312 min read read
The FY2023 cohort charged off at 2.515% within 36 months — the highest since 2010. It is also only the fourteenth-highest of thirty-three cohorts on record. A CPA reads the full loan-level series.
- Do Overconfident Buyers Pay More for Small Businesses?18 min read read
A landmark study on Forbes 500 CEOs shows overconfident executives have 65% higher odds of making an acquisition, and the market reacts 90 basis points more negatively to their deals. The mechanism transfers to private-market buyers. The measurement does not. Here is what a buyer-side test would actually look like.