

Key Insight
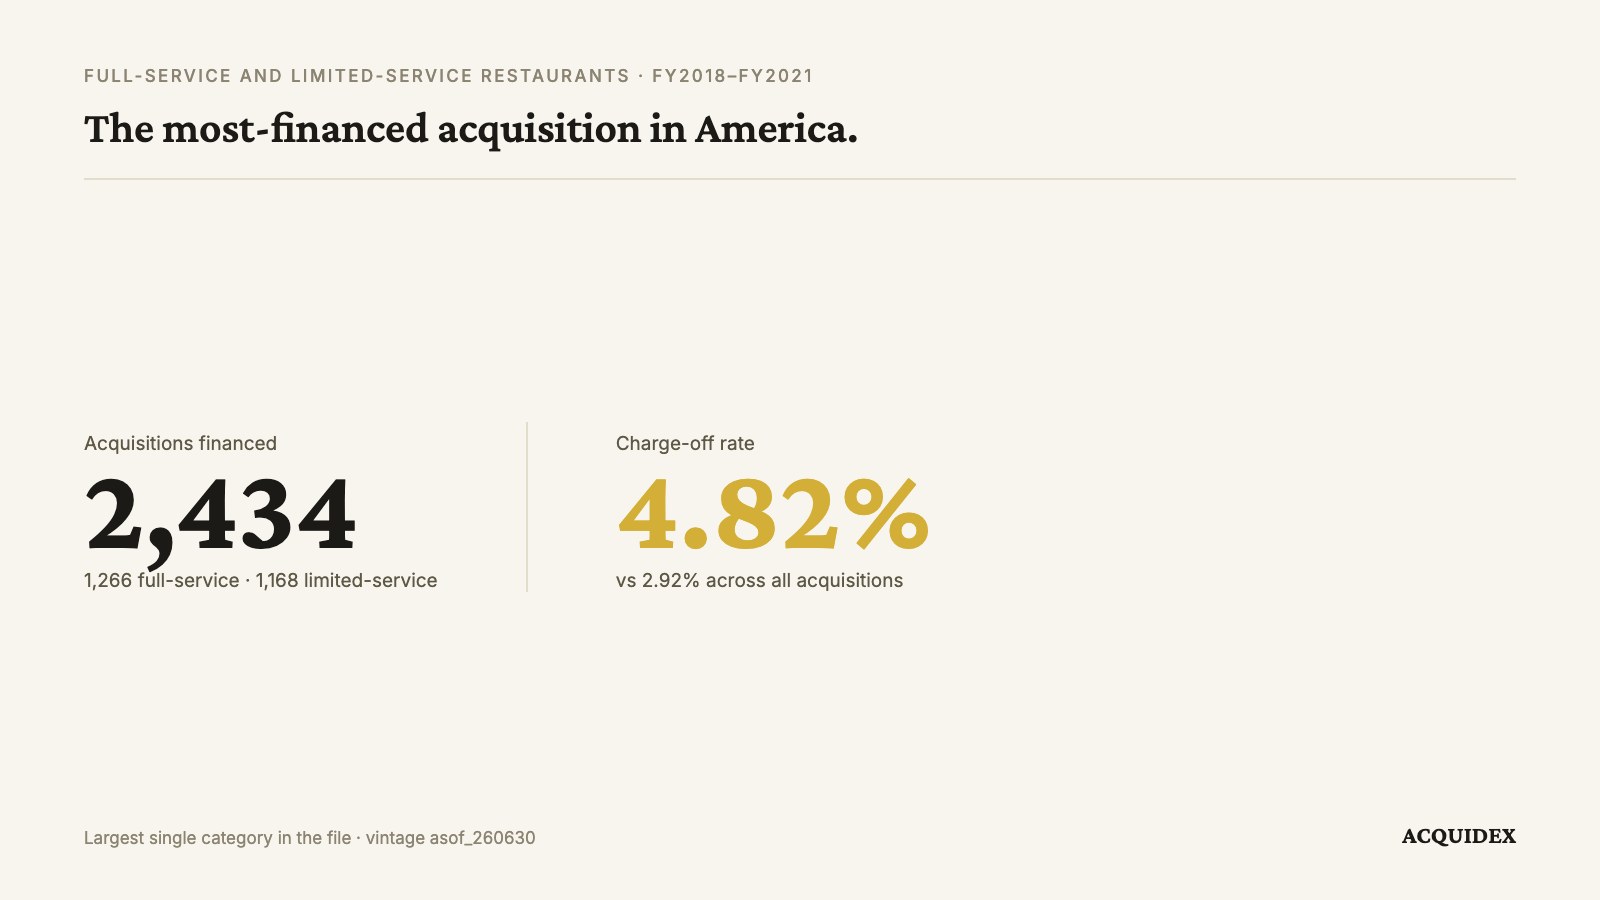
Restaurants are the most-financed acquisition category in the SBA 7(a) loan-level file and among the more likely to charge off. Across acquisitions approved FY2018 to FY2021, full-service restaurants recorded a 4.82% charge-off rate on 1,266 loans and limited-service restaurants 4.45% on 1,168 loans, against an acquisition-wide average of 2.92%. Average realised losses were $275,529 and $305,259 respectively, producing expected losses per deal of roughly $13,276 and $13,590 — effectively identical between the two formats. The rate is approximately 1.6 times the acquisition average but well below fitness centres at 8.60%. Because restaurants are the largest population in the file, the absolute number of failures is high partly as a function of volume rather than unusual fragility. Diligence should concentrate on revenue verified independently of seller reporting through point-of-sale and merchant-processor data, on food and labour cost percentages measured across at least twenty-four months rather than a favourable trailing quarter, on lease term and assignment consent, on equipment condition with particular attention to refrigeration and hood systems, and on separating unpaid owner-operator labour from paid labour. A charge-off is a loan failing rather than a business closing, and this dataset covers SBA-financed acquisitions only.
Restaurants are the most-financed acquisition in America.
Across SBA-financed business acquisitions approved between FY2018 and FY2021, full-service restaurants accounted for 1,266 loans and limited-service for 1,168 — the two largest single categories in the file.
They also charge off more than most things people buy.
| Full-service | Limited-service | |
|---|---|---|
| Acquisitions | 1,266 | 1,168 |
| Charged off | 61 | 52 |
| Charge-off rate | 4.82% | 4.45% |
| Average loss when one failed | $275,529 | $305,259 |
| Expected loss per deal | $13,276 | $13,590 |
Against an acquisition-wide average of 2.92%. So roughly 1.6 times the average — elevated, though well short of fitness centres at 8.60%.
Note the last row. The two formats look different on rate and different on severity, and those differences cancel almost exactly. On expected loss they are the same business.
Should you read the failure count or the failure rate?
The rate. There is a reading error worth avoiding here.
Restaurants produce a large number of failures partly because they produce a large number of deals. When a category is the biggest population in the file, its absolute failure count will look alarming even at an unremarkable rate.
4.82% is elevated rather than catastrophic. It sits closer to landscaping at 4.64% and general automotive repair at 4.01% than to the top of the table.
What that means practically: a restaurant deal is not disqualified by its category. It needs to clear a higher evidentiary bar than a category-average business, and the burden is on the deal to show that it does.
How do you verify restaurant revenue independently?
Restaurants are cash-adjacent in a way most acquisition targets are not, and the P&L is the weakest available evidence.
Ask for point-of-sale exports at transaction level and merchant-processor statements covering the same period. Reconcile both against the tax return. Three sources that agree is evidence; one source is an assertion.
Watch for the gap between recorded sales and deposited funds, and ask what explains it. There are legitimate answers — cash tips, house accounts, third-party delivery settlement timing — and there are answers that tell you the reported earnings will not survive your ownership.
Pay specific attention to delivery-platform revenue. It arrives net of commission, it is reported differently by different platforms, and it carries margin that looks nothing like dine-in. A restaurant that grew through delivery may have grown its revenue and shrunk its economics simultaneously.
Our general framework is in verifying revenue without trusting the seller.
What is the owner-labour trap?
This is the single most common way a restaurant's margins look better than they are.
An owner who works the line, runs the pass, or covers two shifts a week is providing labour the P&L never charges for. When they leave, that labour has to be hired at market rate, and the cost lands entirely in your first year.
Ask specifically: how many hours a week does the owner work in the business, in what roles, and what would it cost to replace each one?
Then reduce earnings by that amount before you value anything.
Our post on how brokers inflate SDE covers the general pattern; restaurants are where it bites hardest.
Why do food and labour costs need twenty-four months?
Food cost and labour cost as a percentage of sales are the two ratios that decide whether a restaurant works.
Insist on at least twenty-four months, measured monthly. A trailing quarter can be engineered by delaying purchases, cutting shifts, or running a period down on frozen stock.
What you are looking for is stability. A food cost that swings four points month to month is telling you something about purchasing discipline, portion control, or theft, and you want to know which before you own it.
Labour deserves the same treatment, and for a specific reason: food service carries structurally high staff turnover relative to other industries, which the Bureau of Labor Statistics tracks monthly in its Job Openings and Labor Turnover Survey. A restaurant's labour line is not a fixed cost you inherit; it is a recruitment cost you keep paying.
What are the lumpy costs and the lease risk?
The lease is frequently the business. Confirm remaining term, renewal options, the rent escalation schedule, and whether the landlord consents to assignment. A restaurant that has to relocate does not relocate its customers.
Refrigeration and hood systems are the two capital items that arrive in lumps and cannot be deferred. Ask for the age and service history of both. A hood system replacement in year one will consume a year of earnings.
Deferred maintenance is a schedule the seller has moved onto you. Walk the kitchen with someone who knows what they are looking at, and price what they find.
How does SBA financing affect a restaurant deal?
Most of these deals run through the SBA 7(a) programme. Two points matter at a 4.82% base rate.
First, restaurants are financeable partly because they are legible — equipment lists, leases, liquor licences and POS reports that read like a cash-flow statement. Ease of underwriting is not the same as quality of business, and the loan volume in this category tracks the former.
Second, as of July 4, 2026, the cumulative 7(a) and 504 limit rose to $10 million, with each programme's individual maximum unchanged at $5 million. For a restaurant deal that includes the building, the operating company and the real estate no longer compete for the same headroom.
What would make us underwrite one?
- Revenue verified from three independent sources that agree.
- Owner labour costed and deducted before valuation, not after negotiation.
- Food and labour stable across twenty-four months.
- A lease with real remaining term and assignment consent already confirmed.
- A kitchen manager or chef who is staying, and who is not the seller.
- Delivery revenue understood on a net-margin basis, not a gross-revenue basis.
A restaurant that clears those is a different proposition from the category average. The base rate is a prior, and evidence is what updates it.
Methodology and limits
Computed from the SBA 7(a) loan-level FOIA extract, public domain, published by the U.S. Small Business Administration and mirrored on data.gov. Vintage asof_260630. Full-service restaurants: 1,266 change-of-ownership loans approved FY2018 to FY2021, 61 charged off within five years of approval. Limited-service: 1,168 loans, 52 charged off.
A charge-off is a loan failing, not a business failing. This is SBA-financed acquisitions only — cash and seller-financed deals are invisible here. Loan amount is not purchase price. FY2020 and FY2021 cohorts are flattered by CARES Act Section 1112, which paid six months of instalments for those borrowers. Recent vintages have not seasoned and are excluded.
Analysis by Avery Hastings, CPA, founder of Acquidex.

Avery Hastings, CPA
Founder, Acquidex • CPA • Tokyo, Japan
Avery Hastings is a CPA based in Tokyo, Japan and the founder of Acquidex. She focuses on helping buyers evaluate small-business deals with clear cash-flow logic, realistic downside analysis, and practical diligence frameworks.
Keep up with Avery →Sources
Keep Reading
- How Many Small Businesses Actually Sell Each Year?7 min read read
- How Do You Choose a Quality of Earnings Provider?9 min read read
- Should a Seller Get a Sell-Side Quality of Earnings?9 min read read
- What Happens When a Quality of Earnings Report Comes In Low?10 min read read
- Should a Seller Disclose a Problem Before Listing? The Cost Asymmetry Nobody Explains7 min read read
- How to Analyze a Gym or Fitness Business Acquisition9 min read read