

Is the silver tsunami arriving?
Seven annual Census readings show no surge of sellers building. The share of owners aged 55 or over barely moved. The share past 65 is creeping up, and those owners are already leaving, at about 8% a year. This page keeps the readings behind that answer, and the ones that would change it.
| Reading | Latest | Period | For comparison |
|---|---|---|---|
| Owners aged 55 or over, share of all owners | 51.3% | 2023 | 50.8% in 2017 |
| Owners aged 65 or over | 23.1% | 2023 | 20.1% in 2017 |
| Business acquisitions the SBA approved financing for | 7,112 | fiscal 2025 | 4,876 in fiscal 2023 |
| The same under 7(a), first nine months of fiscal 2026 | 4,420 | October to June | 5,048 in the same months a year earlier |
| Acquisitions as a share of 7(a) loans | 12.4% | fiscal 2026 to June | 13.6% in fiscal 2020 |
| Businesses that pass all four tests | 92,986 | of 6,077,257 with employees | |
| Of those, changing hands with SBA financing | 204 | a year | 0.22% a year, or 1 in 457 |
Not a bigger pool. An older one.
The 55-and-over line is flat. The over-65 share rose 2.9 points, from 20.12% to 23.06%. The 55-to-64 share fell 2.5 points over the same six years. Owners are moving from the younger band into the older one.
The 2024 and 2025 owner files. The series stops at 2023. If the 55-and-over share jumps in either, the premise of this piece weakens and we will say so.
The figures
| Reference year | 55 or over | 55 to 64 | 65 or over |
|---|---|---|---|
| 2017 | 50.80% | 30.68% | 20.12% |
| 2018 | 50.81% | 30.37% | 20.44% |
| 2019 | 50.94% | 30.06% | 20.88% |
| 2020 | 51.08% | 29.70% | 21.38% |
| 2021 | 52.28% | 29.51% | 22.77% |
| 2022 | 51.71% | 28.92% | 22.79% |
| 2023 | 51.28% | 28.22% | 23.06% |
Is the SBA’s own count rising?
The count dipped, then climbed to a new high. The dip was in fiscal 2022 and 2023. Fiscal 2025, at 7,112, was 15% above the previous high in 2021.
This year looks lower, but it is missing a month. The first nine months of fiscal 2026 show 4,420 under 7(a), against 5,048 in the same months a year earlier. The file records no approvals at all in October 2025, when the federal government was shut down. So the monthly pace is about the same.
Buying a business is a smaller slice of SBA lending than it was. It was 13.6% of 7(a) loans in fiscal 2020. It was 8.9% in 2024 and 10.7% in 2025. The slice is smaller.
This year only looks better. So far in fiscal 2026 the slice is higher, at 12.4%. But that is only because other SBA lending fell by almost a third. Loans to buy a business are 12% below the same nine months a year earlier, or 3% below leaving out the month the government was shut. So the bigger slice is not more sales. Two strong years follow two weak ones, and the climb has paused.
The SBA's own count. SBA-financed acquisitions rose from 4,876 in fiscal 2023 to 7,112 in 2025. In fiscal 2026 they are running level with that or a little below. Suppose the count starts climbing again and keeps climbing for several years while other SBA lending does not. That is a wave showing up in sales, and this piece is wrong about timing.
Every transaction figure in this series comes from the loan files of the Small Business Administration (SBA): the loan-by-loan records it releases for its two lending programmes, 7(a) and 504. They are the only free, public, deal-level record of business sales that we know of. (Listing sites and broker groups publish summaries, not the deals.) Our best reading of Census data is that the SBA finances about a tenth of business sales. The rest happen on seller notes, cash, private credit and conventional bank debt, and are invisible to us. Seller notes are financing too, so to be precise: when this piece says "financed", it means SBA-financed. Read every rate here as that market, and treat it as a floor. Where it matters most, we say so again.
What is actually out there
Four questions, asked in order. Almost everything fails one of them. Each row shows what continues on the left and what drops out on the right, itemised so that every number can be checked. Census counts 6,294,604 employer firms in all, and 6,404,038 once a firm is counted in each industry it works in. The first box takes that second figure and leaves out membership and religious organisations, funds and holding companies, which are not bought and sold as businesses.
Start: every business in the United States that a private buyer could own.
- 1. Does anyone work there?6,077,257Businesses with employees−30,427,808Nobody works there. You would be buying a job.average revenue $57,611 a year
- 2. Does a licence get in the way?3,556,035No licensed profession or trade at its core−2,521,222A licensed trade is involved, or we could not tell
- 1,601,343 an owner or named qualifier must hold it
- 481,079 only the staff or the premises are licensed
- 438,800 not classified, mostly shops
- 3. Does it survive you leaving?438,12520 to 999 people−3,117,910Too small to run without its owner, too big, or unsized
- 3,087,873 under 20 people: the owner is the business
- 25,898 1,000 or more people: not a small business
- 4,139 Census does not give a size
- 4. Is it in a large, safer-than-average industry?92,98634 large, safer-than-average industries−345,139Riskier, unrated, or too small an industry
- 208,716 in industries whose loans go bad more than average
- 115,785 in industries we cannot rate
- 20,638 safer than average, but a small industry
That is 0.22% a year, or 1 in 457. Counting every route to a sale, perhaps 1 in 45.
Sources: Census Nonemployer Statistics 2023; Statistics of US Businesses, 2021 firm-size tables; BLS Occupational Employment and Wage Statistics, May 2024; SBA 7(a) FOIA as of 30 June 2026, loans approved FY2010–19, for risk; SBA 7(a) and 504 FOIA, loans approved FY2020–25, for sales.
The exits are already running
About 1.4 million businesses have an owner aged 65 or over. At the SBA's best pace that is 190 years of work, which only shows how small the SBA's slice is. Those owners are already leaving at about 8% a year, and if the only public measure is a guide, most of their businesses will not be sold. Selling one more in ten would take about 11,000 more sales a year, a fifth more than we estimate happen today. Our best guess at what would have to grow is the layer of people in the middle, and nobody counts it.
At that pace, half of today's over-65 owners will have left within about 8 years, and two thirds within 13. Nothing has to speed up for these owners to leave.
The forecasters' own high case is not a wall of water. The pace may still rise as the largest birth years pass 70. McKinsey's model has exits reaching as many as 665,000 a year, against 510,000 in 2022. That is up to 30% more, on a flow that is already running. And the same model counts 92% of exits as closures.
| Where it stands now | Owners | Share |
|---|---|---|
| No longer in operation | 355,740 | 58% |
| Bought by another person or company | 118,465 | 19% |
| "Other", which Census does not define | 142,904 | 23% |
| Total | 617,109 | 100% |
Census Annual Business Survey, reference year 2023, owners in the firms that answered.
Census gives the only guide to how many. Of owners' previous businesses that are no longer theirs, 19% were sold, 58% had closed and 23% were "Other". That comes from the earlier ventures of people who own a business today. It holds no final exits at all, so applying it to retiring owners is our assumption. The sold share may be too low for a going concern with staff.
Apply it to today's 1.4 million and most would not be sold. About 260,000 would be sold, about 780,000 would close, and about 315,000 would end some other way.
| If today's over-65 owners all exit in… | Businesses losing their owner a year | Sales a year if 19.2% sell | Extra sales a year per 10 more points sold |
|---|---|---|---|
| 10 years | 136,000 | 26,100 | 13,600 |
| 15 years | 91,000 | 17,400 | 9,100 |
| 20 years | 68,000 | 13,100 | 6,800 |
Census ABS shares, reference year 2023, applied to 5.9 million employer firms. Assumes 1.36 million businesses with an owner aged 65 or over (23.1% of 5.9 million), the 19.2% sold share, and that every one of those owners exits inside the window. Each is an assumption, not a measurement.
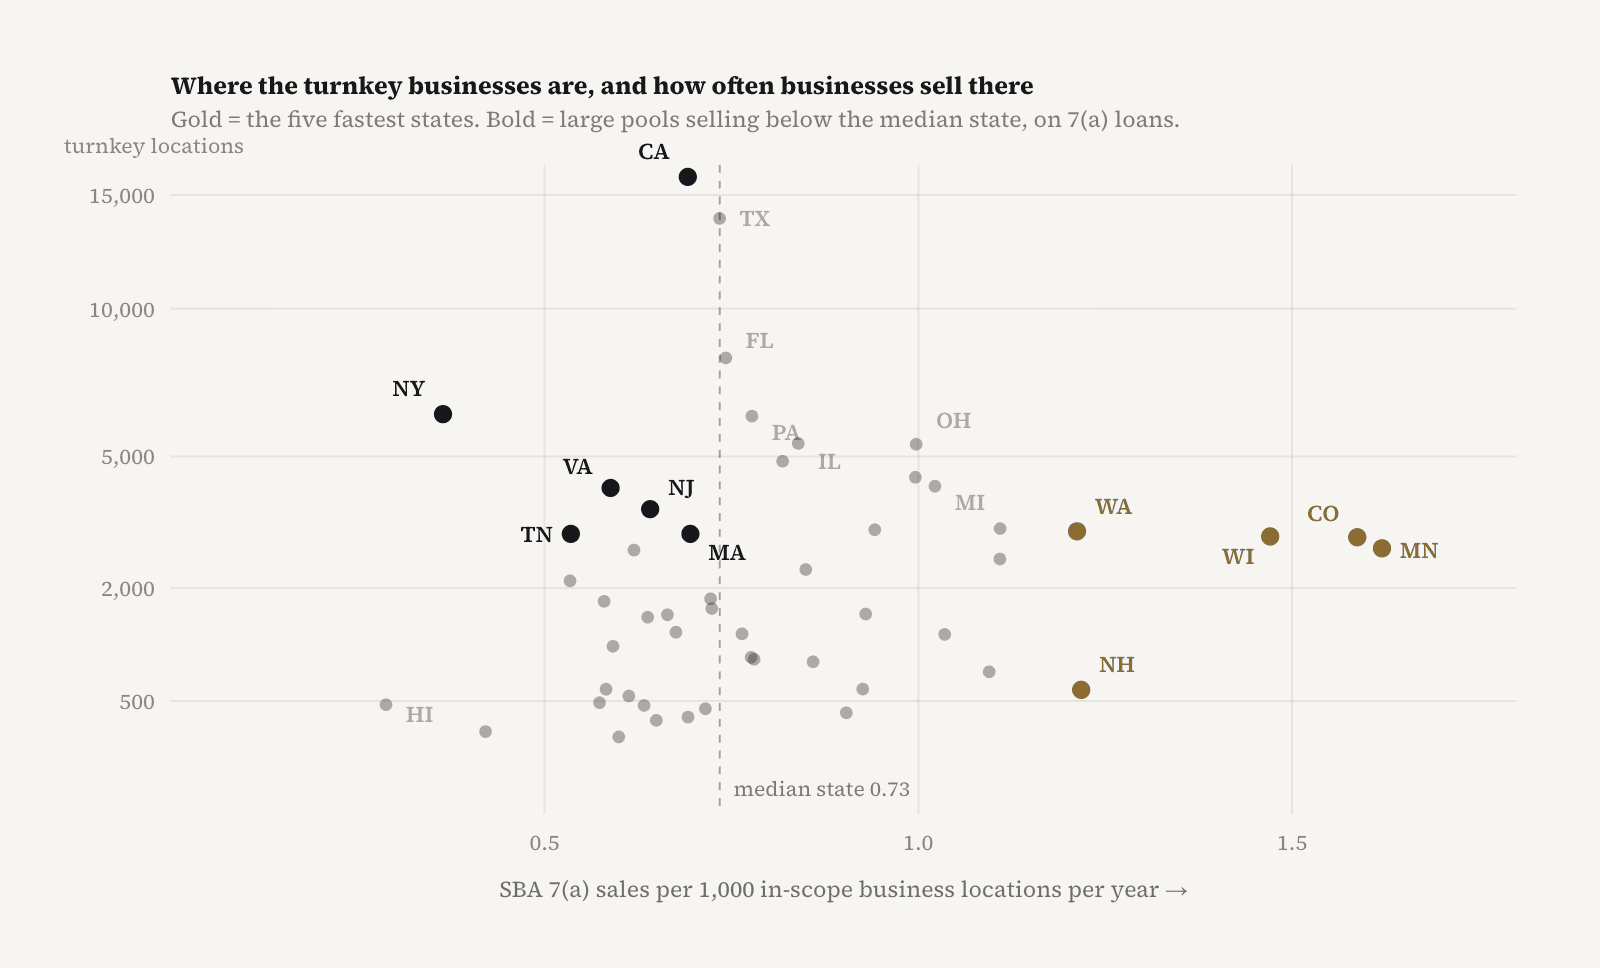
Where the turnkey businesses are, and how often businesses sell there
None of the six biggest pools is a fast market. California holds 15,894 business locations with 20 or more staff in the 34 industries — the most of any state — and sells at 0.69 per 1,000 a year. New York holds 6,261 and sells at 0.36, a rate only Hawaii undercuts. Texas, Florida, Pennsylvania and Illinois sit near the middle, at 0.73 to 0.84. Minnesota, Colorado and Wisconsin sell more than twice as fast as California and hold under 3,100 each. Each dot is a state. The horizontal axis is the sale rate for in-scope locations of every size, on 7(a) loans. The vertical axis is square-root scaled so the small states stay visible. Locations add up to 140,745, against 92,986 firms nationally, for three reasons. One firm can have several locations. A location count cannot leave out branches of very large firms. And it is two years later.
What would change our mind
- The 2024 and 2025 owner files. The series stops at 2023. If the 55-and-over share jumps in either, the premise of this piece weakens and we will say so.
- The SBA's own count. SBA-financed acquisitions rose from 4,876 in fiscal 2023 to 7,112 in 2025. In fiscal 2026 they are running level with that or a little below. Suppose the count starts climbing again and keeps climbing for several years while other SBA lending does not. That is a wave showing up in sales, and this piece is wrong about timing.
- A real census of business brokers. Our proxy is real estate brokerage offices, which are mostly residential agents. If a proper count showed no relationship, the reading above is wrong.
- Any count of sales made without an SBA loan. On our reading they outnumber SBA-financed sales by about nine to one. If they turn out to be common exactly where SBA-financed sales are rare, most of the geography in this series is an artefact.
Weird economics, diligence insights and practical takeaways for anyone buying, selling or financing a small business.
Every figure here is printed in the research piece or sits in the computation behind its charts, and the words beside each chart are the piece’s own. SBA figures are from the agency's own loan-level FOIA releases, with data as of 30 June 2026 for 7(a) and 31 March 2026 for 504. When an agency publishes a new reading, the figure and the date at the top of this page change.
The Silver Tsunami Is Ageing, Not Arriving