


Key Insight
There is no small business discount so much as a diversification tax, and it is measurable. A public company multiple prices risk for a shareholder holding hundreds of positions, where company-specific risk cancels across the portfolio and only market-correlated risk is priced. A private owner holds one company, so nothing cancels. Aswath Damodaran's published industry datasets put median beta at 0.78 and median total beta — the undiversified measure — at 3.02 across the 89 industries carrying at least five companies. Total beta is beta divided by correlation, and across those industries the median correlation is 0.25, meaning roughly 94% of what happens to a typical business has nothing to do with the economy. Running the same capitalisation formula twice on a 4.5% risk-free rate, a 5% equity risk premium and 2% long-term growth produces 15.6x for the diversified holder and 5.7x for the single owner: a 2.7-turn difference from diversification alone. On $340,000 of earnings that is roughly $5.3 million against $1.9 million, a $3.4 million gap created by nothing happening inside the business. Counter-intuitively, low-beta businesses show the largest gaps, because low correlation is exactly what inflates total beta: healthcare support services runs 0.74 beta against 4.31 total beta, and the ranking can invert, with grocery worse than retail special lines on total beta despite looking safer on beta. The measure describes price, not failure probability, and the 2.7x spread excludes size, illiquidity, marketability and owner dependency, so it is a floor rather than a total.
A word on scope
Every figure here comes from one source: Aswath Damodaran's published industry datasets at NYU Stern, specifically totalbeta.xls, pulled 3 August 2026. The file is free, public, and updated annually. Damodaran publishes 94 industry groups; I restricted to the 89 with at least five companies, so no result rests on one or two firms. That floor is mine, not his.
This is illustrative math on stated assumptions. It is not a valuation, and it is not advice about any specific business. The final multiples depend entirely on three inputs I chose — a 4.5% risk-free rate, a 5% equity risk premium and 2% long-term growth — and all three are stated in the open so you can substitute your own.
The honest limitation, up front: the two medians do not come from the same industry. Median beta and median total beta are both drawn from those 89 groups, but they are medians of different distributions and I use them to describe a spread rather than to price anything. Where a single business is being discussed, both figures come from its own row. Full method at the end.
Why does the same business get two different prices?
A woman runs a home-care agency. $1.8 million in revenue, about $340,000 in earnings, eleven years old, forty caregivers, three referral sources that send most of the work.
She reads that healthcare businesses trade in the low teens. Her broker says three times. Somebody tells her that is the small business discount and she should accept it.
The word discount is doing a lot of work there, and it is the wrong word. A discount implies the same thing being sold cheaper. What is actually happening is that two buyers are pricing two genuinely different risks, and both are correct.
Beta measures how much a business swings relative to the stock market. The market is 1.0; a beta of 0.78 means it swings about 78% as much. Critically, beta only counts the portion of risk that moves with the market, because the standard theory assumes the holder is diversified and can diversify the rest away.
That assumption is true for a fund. It is false for her.
Total beta is the same measure with the assumption removed. It is beta divided by the correlation between the business and the market, which restores the risk a diversified investor is entitled to ignore. Damodaran built it precisely for valuing private businesses where the owner holds nothing else.
Across the 89 qualifying industries:
Median beta — the diversified number: 0.78 Median total beta — the undiversified number: 3.02
Those are not two opinions about risk. They are the same risk, priced by two people with different portfolios.
Because beta only prices the risk a diversified shareholder cannot escape, and total beta prices all of it. Across 89 industry groups the median beta is 0.78 and the median total beta is 3.02. Nothing about the underlying business changes between those two numbers — only the assumption about what else the holder owns.
Why is the gap so large?
It comes down to correlation. Total beta is beta divided by correlation: divide by a small number, get a big one. That is the whole formula.
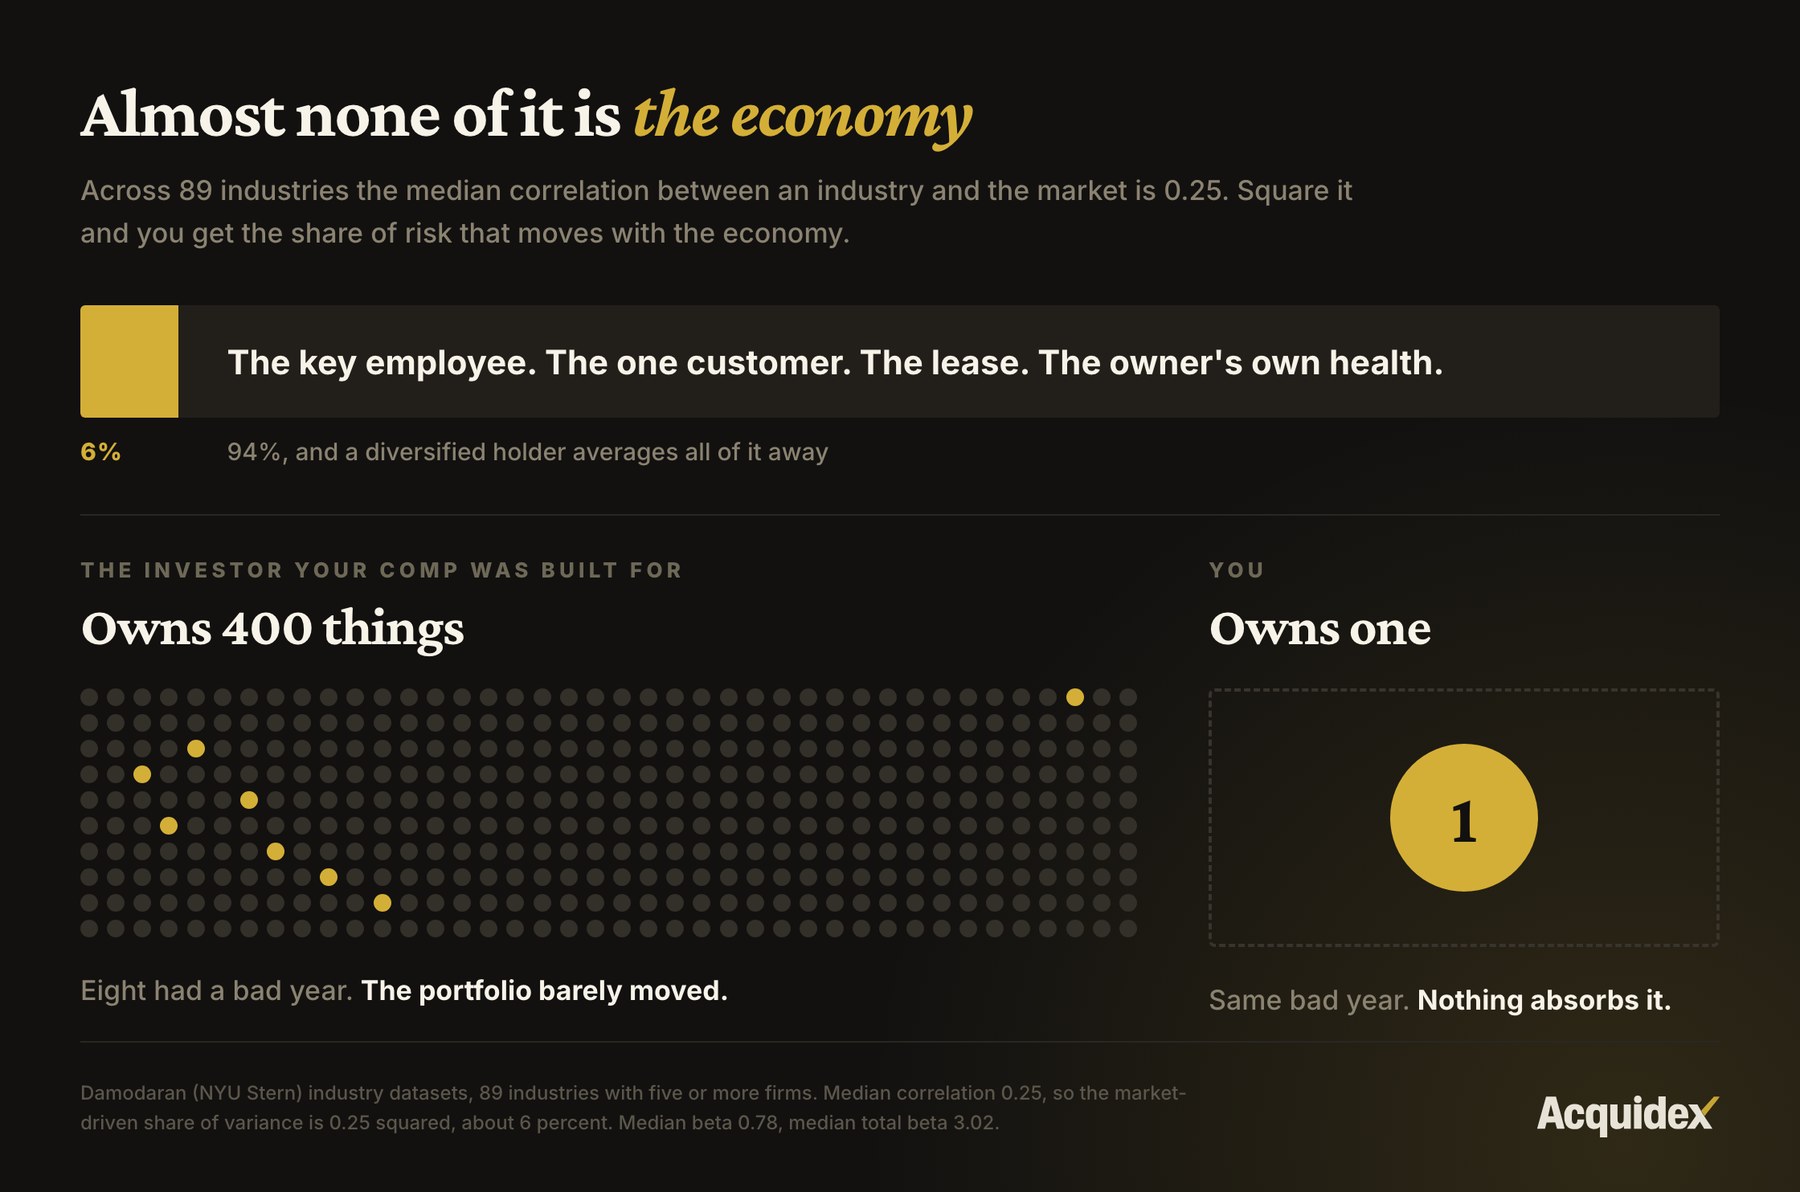
Across those 89 industries, the median correlation is 0.25.
Correlation runs 0 to 1. At 1.0 a business moves in lockstep with the economy; at 0 it does its own thing entirely. At 0.25, most of what happens to it has nothing to do with the economy. To find the share that is economic, square it: 0.25 × 0.25 = 0.06.
So roughly 94% of what happens to a typical business has nothing to do with the economy.
It is the key employee. The one big customer. The lease. The competitor who opens across the street. The owner's health.
A fund holding four hundred companies does not care about any of it. Those risks cancel: one company loses a key employee, another does not, and it averages away. That averaging is what earns a fund the right to price only the 6%.
Our seller holds one company. Nothing cancels. Every one of those risks lands on her balance sheet, which is also her house.
Which businesses show the biggest gap?
Regular beta first, then the number for someone who owns one.
| Industry | Beta | Total beta |
|---|---|---|
| Auto & Truck | 1.31 | 7.07 |
| Retail, Grocery & Food | 0.85 | 4.87 |
| Environmental & Waste | 0.82 | 4.70 |
| Healthcare Support Services | 0.74 | 4.31 |
| Retail, Special Lines | 1.00 | 4.03 |
| Restaurant / Dining | 0.78 | 3.26 |
| Homebuilding | 0.85 | 3.05 |
| Education | 0.72 | 2.94 |
| Hotel / Gaming | 0.88 | 2.90 |
| Trucking | 0.87 | 2.40 |
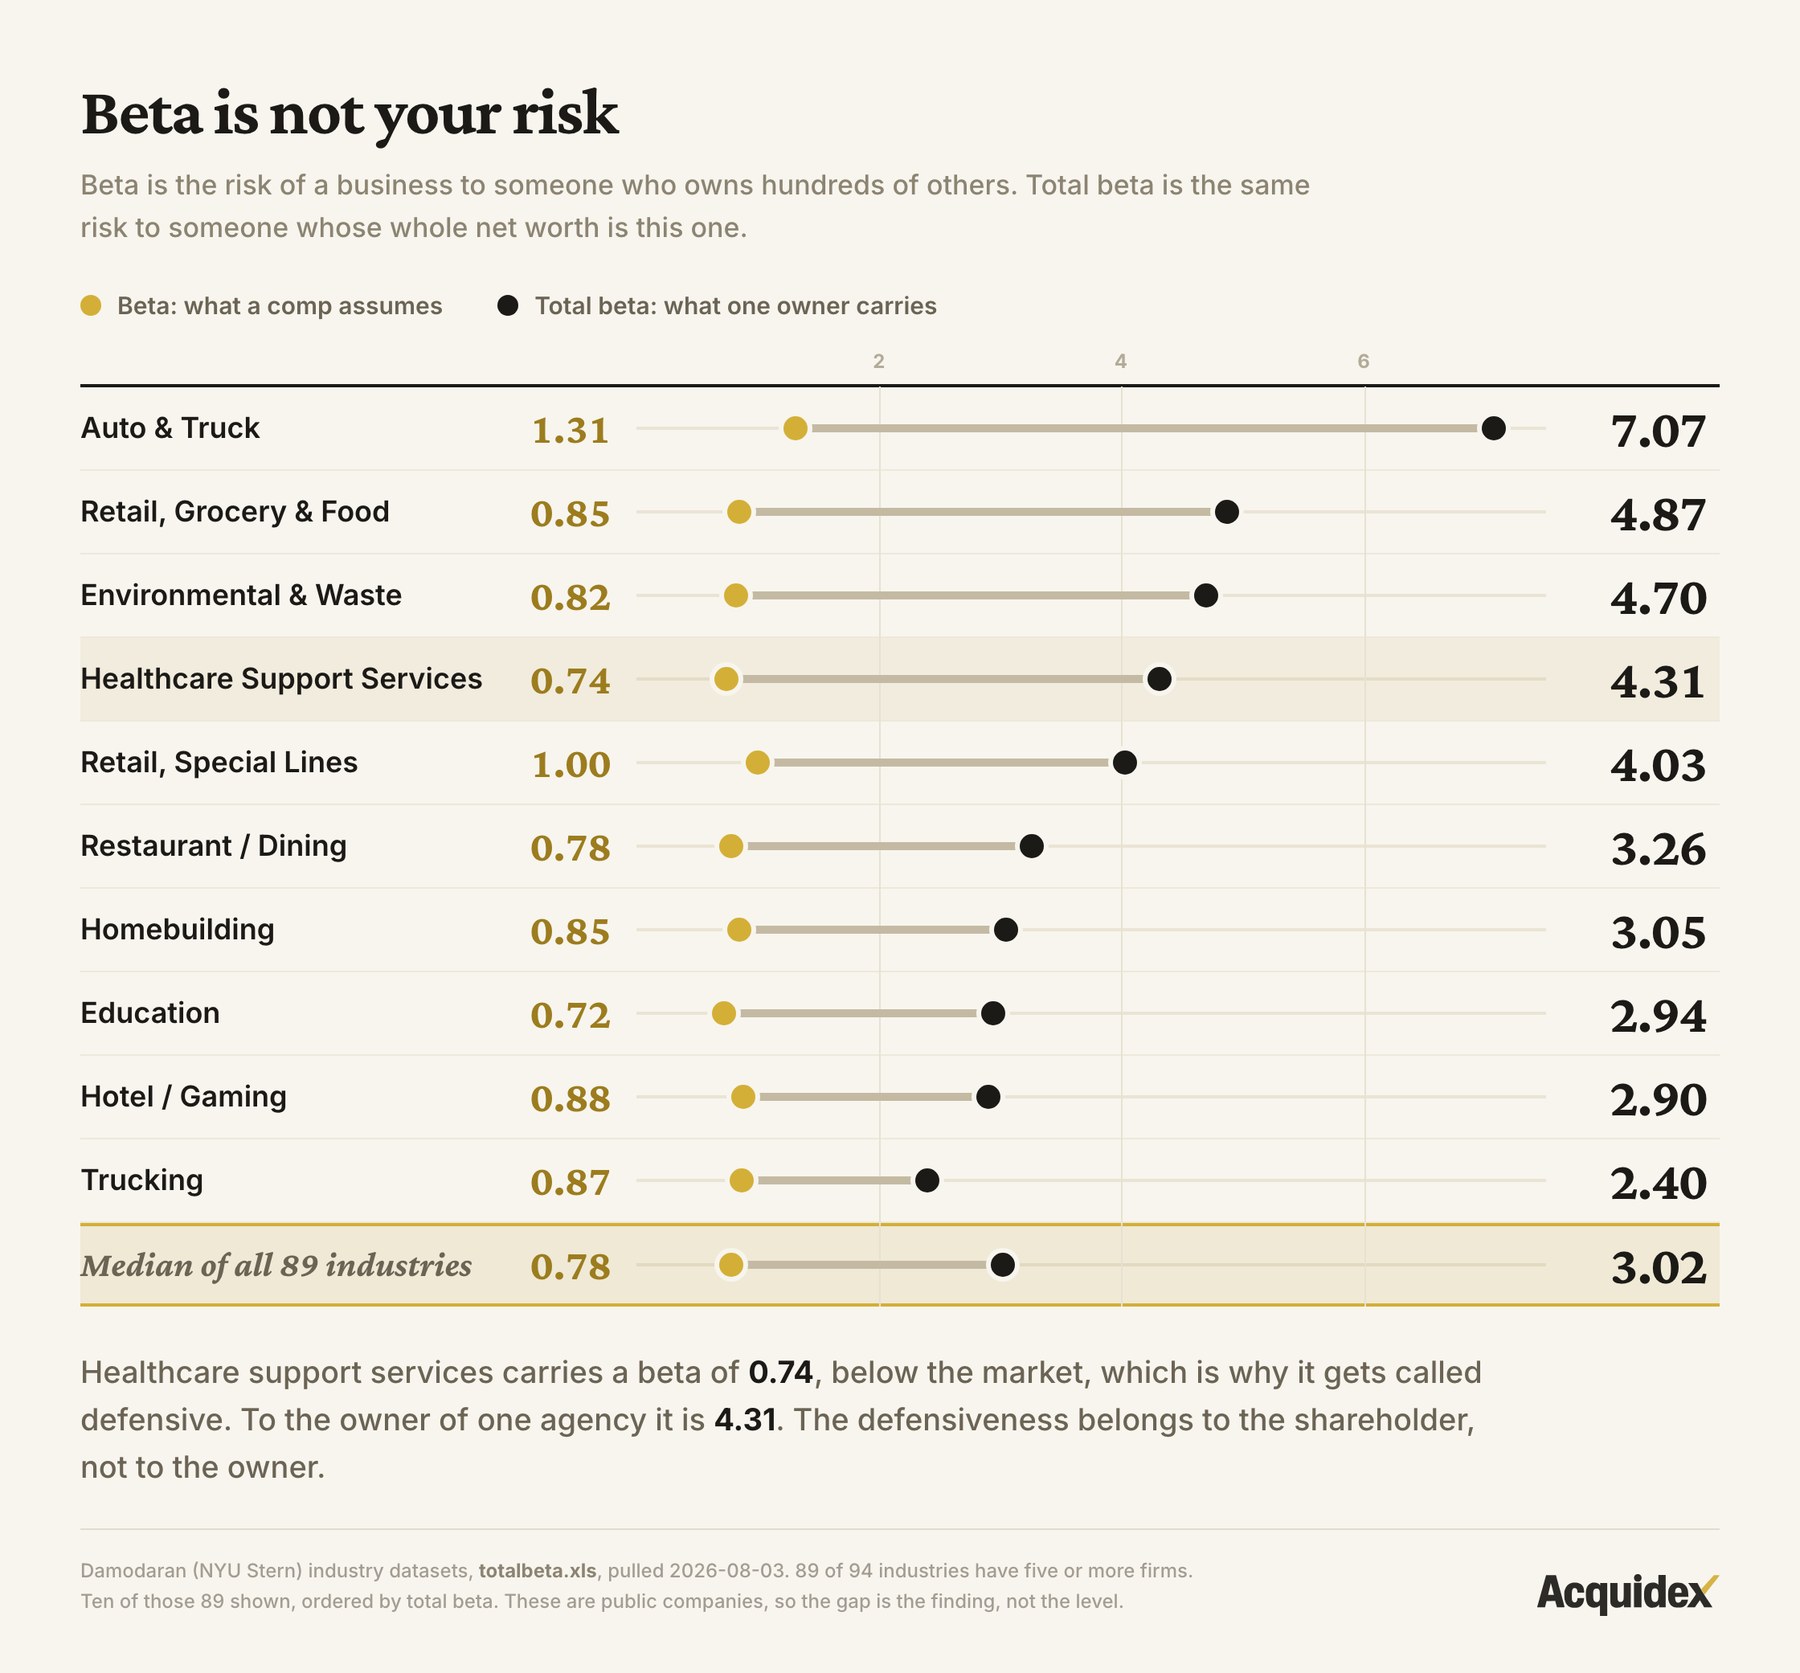
Find healthcare support services, the seller's row. Beta of 0.74, below the market. On paper a safe business, which is why healthcare earns a premium in every broker deck ever written.
For someone who owns one, it is 4.31 — one of the largest gaps in the dataset.
That is backwards from what most people expect, and it is the most useful thing in this article. The property that makes her business attractive to Wall Street is the same property that makes it expensive to her. Low correlation is excellent if you hold four hundred other things. Held alone, low correlation is exactly what drives the required return up.
The safety is real. It belongs to a shareholder in a healthcare fund. It does not belong to the woman who owns the agency.
One more feature of that table: the order flips. On beta, retail special lines (1.00) looks riskier than grocery (0.85). On total beta grocery is worse, 4.87 against 4.03. Use the wrong measure and you will rank businesses incorrectly for the buyer sitting in front of you.
The low-correlation ones, which is counter-intuitive. Healthcare support services carries a below-market beta of 0.74 and a total beta of 4.31. Auto and truck runs 1.31 to 7.07. The relative ranking between industries can reverse entirely between the two measures, so a comparable set built on beta will mis-rank businesses for a private buyer.
What does the arithmetic actually look like?
Five steps, run twice. Assumptions: a 4.5% risk-free rate, a 5% equity risk premium, 2% long-term growth. Standard numbers, but they are my picks.
The risk-free rate is what you would earn lending to the government, the return for taking no risk. The equity risk premium is the extra demanded for owning businesses instead. Multiply the premium by the risk measure, add the risk-free rate, and you get what the holder needs to earn every year.
| Step | Wall Street | The owner |
|---|---|---|
| 1. Risk measure | 0.78 | 3.02 |
| 2. × 5% equity risk premium | 3.9% | 15.1% |
| 3. + 4.5% risk-free rate | 8.4% | 19.6% |
| 4. − 2% growth | 6.4% | 17.6% |
| 5. Flip it (1 ÷ rate) | 15.6x | 5.7x |
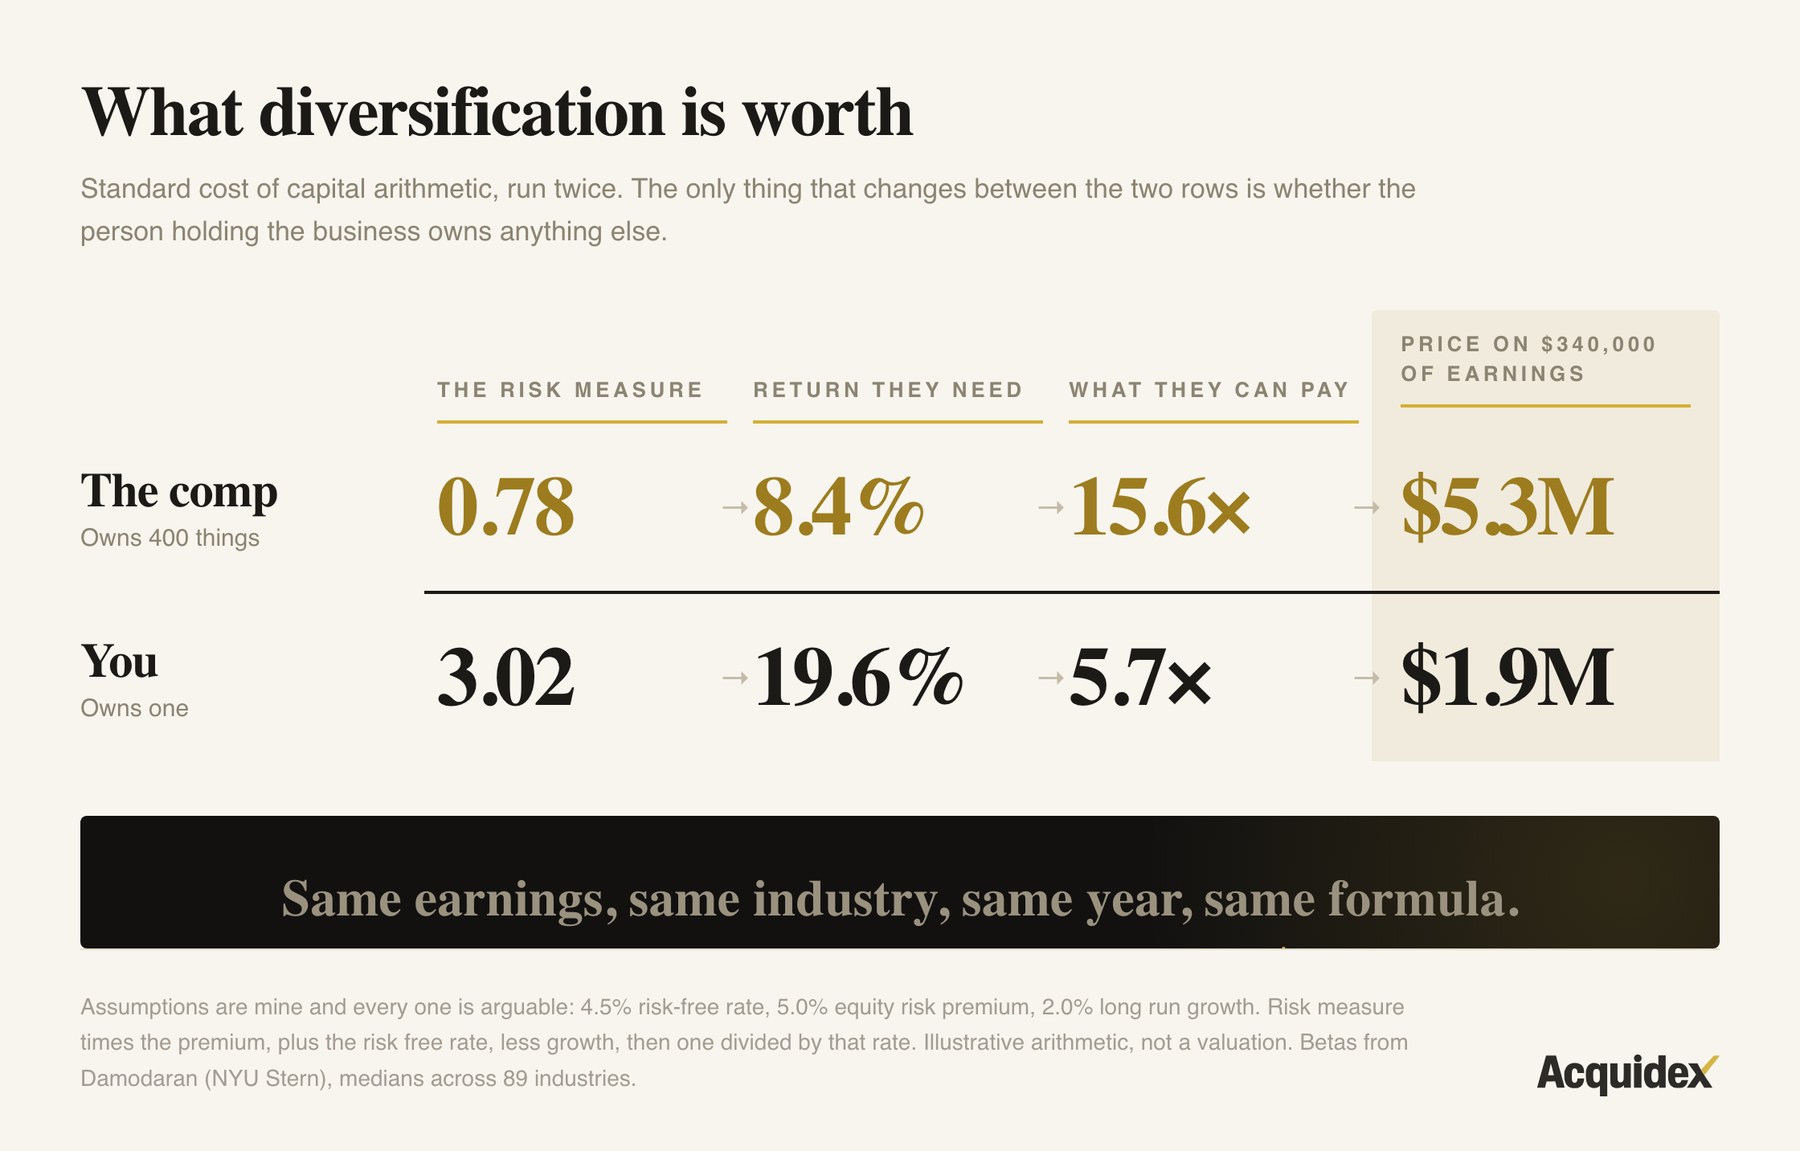
Same business. Same year. Same formula. The only thing that changed is whether the holder owns anything else.
That is a 2.7x difference in the multiple, from diversification alone.
On her $340,000 of earnings, that is roughly $5.3 million against $1.9 million. A $3.4 million gap created by nothing that happens inside the business.
Now set that beside the gap people actually argue about: public companies in the low teens, Main Street at two to three times. Diversification explains a large part of it. Not all — size, illiquidity and the small buyer pool do the rest, and they all push the same direction.
But most of what gets called a discount turns out to be arithmetic.
Five steps: risk measure, times the equity risk premium, plus the risk-free rate, minus growth, inverted. Run with 0.78 it gives 15.6x. Run with 3.02 it gives 5.7x. On $340,000 of earnings that is $5.3M against $1.9M. Nothing inside the business changed between the two columns.
Does this mean small businesses are bad investments?
No, and the reason is worth sitting with, because it inverts the whole framing.
A 19.6% required return is not a warning. It is a return. It is what the owner needs to earn annually to be compensated for holding undiversified risk, and if the business delivers it, they have been compensated correctly. The person paying 5.7x is not overpaying for a bad asset; they are paying the price at which an undiversified holder earns a fair return for the risk they are actually carrying.
Turn it around. A buyer purchasing at 15.6x — the diversified price — on cash flows they will hold alone would be earning roughly 8.4% for bearing 19.6% worth of risk. That is the genuinely bad trade, and it is the trade a buyer makes every time they anchor on a public comparable.
So the low multiple is not the problem. The low multiple is the protection.
This also explains something that confuses first-time buyers, which is why private equity appears to outbid them constantly on the same businesses. A fund holding dozens of platform companies genuinely faces less risk per dollar of cash flow than a searcher buying one. They are not being reckless and they do not have secret information. They are correctly paying a diversified price because they are a diversified holder.
The searcher who walks away from that auction has not lost. They have declined to pay a price that only works for somebody with a different balance sheet.
No. A 19.6% required return is compensation, not a warning, and the low multiple is what delivers it. The bad trade is paying a diversified price for cash flows held alone, which is exactly what anchoring on a public comparable produces. It also explains why funds appear to outbid searchers constantly: they are correctly paying a diversified price because they are diversified holders.
What are the four risks that don't cancel?
Total beta is one number standing in for four real exposures. In this business they are concrete.
One customer leaves. Three referral sources send most of the work. A fund holding four hundred companies experiences one referral relationship ending as noise. She experiences it as a third of revenue.
One person quits. The scheduler who knows every client and every caregiver. In a portfolio, key-person risk averages out across hundreds of key people. She has one.
The rent and the loan do not care. Fixed obligations continue through a bad quarter. A diversified holder offsets a bad quarter somewhere with a good one elsewhere. She offsets it with savings.
Her own health. This has no analogue in public markets at all, and it is the reason total beta exists as a measure. No shareholder's personal health affects the cash flows of a company they own 0.01% of.
None of these are exotic. They are the ordinary texture of owning one business, and they are exactly the risks a public multiple is entitled to ignore.
What does this mean for buyers and sellers?
For buyers, the practical move is to ask whose risk your comparable describes. Every multiple came from somebody's portfolio. If it came from public markets, it describes a shareholder, and your client is not a shareholder — they are the whole portfolio.
Three things worth discarding along the way.
"Low beta means it is a safe buy." Backwards for a single owner. Low beta usually means low correlation, and low correlation is exactly what makes total beta large.
"The discount is the broker being conservative." It is not a negotiating posture. It is a different required return applied to the same cash flows, and it survives however hard you argue.
"Total beta means the business is fragile." It means the price is lower. Higher required return, lower multiple. It says nothing about survival probability, and quoting it as a failure statistic is a misreading.
If you want to attack the gap rather than accept it, attack the correlation inputs rather than the formula: revenue that is contracted rather than relational, a management bench that removes key-person exposure, customer concentration reduced deliberately. Those change the business. Arguing about the multiple does not.
For sellers, stop apologising for the multiple. The teens figure being compared to belongs to somebody holding four hundred other things, and the comparison was never valid.
What that reframing buys is a better conversation. A seller who understands that the gap is structural stops treating every offer as an insult and starts asking the only question that moves it: which specific risks can be removed before the sale, and what is each one worth. Owner dependency, customer concentration and undocumented revenue are all correlation problems wearing different clothes, and all three are addressable on a two to three year horizon.
Related reading on the pricing side: what a good SDE multiple actually looks like and when a 3× multiple is expensive, which approaches the same question from cash flow quality rather than from risk measurement.
Sources & method
Source. Aswath Damodaran, NYU Stern, published industry datasets — totalbeta.xls. Free, public, updated annually. Pulled 3 August 2026.
Population. 94 published industry groups. 89 have five or more companies, and that floor is mine rather than his, so that no result rests on one or two firms. Every figure above comes from those 89.
Measures. Beta as published. Total beta as published, which is beta divided by the correlation of the industry with the market. Median correlation across the 89 groups is 0.25; the implied non-market share of variance is 1 − 0.25², or roughly 94%.
The capitalisation math. A 4.5% risk-free rate, a 5% equity risk premium and 2% long-term growth, applied identically to both risk measures. Required return equals the risk-free rate plus the premium times the risk measure; the capitalisation multiple is the inverse of required return less growth.
Limitations.
The last step is illustrative. The 15.6x and 5.7x depend entirely on the three assumptions listed. All three are stated. Substitute your own and the gap moves, but it does not close, because the risk measure is doing the work.
It is about price, not failure. A higher total beta means a higher required return and therefore a lower multiple. It does not mean the business is more likely to fail.
The earnings measures do not match perfectly. Public multiples use EBITDA or net earnings; Main Street uses SDE, which includes the owner's pay. I used a single $340,000 figure throughout to keep the arithmetic readable. On a real deal you would reconcile those first, and that alone moves the answer.
Medians are medians. Median beta and median total beta come from the same 89 industries but are not the same industry's numbers. They describe a spread, not a price.
Not included. No adjustment for size, illiquidity, marketability or transferability. All of those push the private multiple lower still, which means the 2.7x gap is a floor rather than a total.
Public markets price risk for someone holding four hundred businesses. If you are holding one, that number was never describing you.

Avery Hastings, CPA
Founder, Acquidex • CPA • Tokyo, Japan
Avery Hastings is a CPA based in Tokyo, Japan and the founder of Acquidex. She focuses on helping buyers evaluate small-business deals with clear cash-flow logic, realistic downside analysis, and practical diligence frameworks.
Keep up with Avery →Sources
No external sources are cited in this article.
Keep Reading
- Adjusted EBITDA Is the One Number in a Deal No One Can Prove7 min read read
Adjusted EBITDA — or its Main Street cousin, SDE — sets the asking price, anchors the negotiation, and sizes the loan. It is also the only number in the deal that is an argument rather than a measurement. A CPA reads the add-back schedule.
- Are SBA Loan Defaults Actually Rising? Charge-Off by Approval Year, 1991–202312 min read read
The FY2023 cohort charged off at 2.515% within 36 months — the highest since 2010. It is also only the fourteenth-highest of thirty-three cohorts on record. A CPA reads the full loan-level series.
- Do Overconfident Buyers Pay More for Small Businesses?18 min read read
A landmark study on Forbes 500 CEOs shows overconfident executives have 65% higher odds of making an acquisition, and the market reacts 90 basis points more negatively to their deals. The mechanism transfers to private-market buyers. The measurement does not. Here is what a buyer-side test would actually look like.