


Key Insight
Roughly three-quarters of top pass-through profit is a return to owner human capital rather than to capital. The evidence is two natural experiments run on tax records linking about eleven million firms to their owners: profit fell 82% after an owner's premature death and 83% after owner retirement, measured against closely matched firms where no such event occurred. A conventional replacement-salary add-back prices the same person at roughly 17%.
How much of small-business profit is actually the owner?
About three-quarters of top pass-through profit is attributable to owner human capital rather than to the firm's capital stock. Smith, Yagan, Zidar and Zwick reached that figure in Capitalists in the Twenty-First Century, published in the Quarterly Journal of Economics, by averaging the measured profit impact of an owner's departure across three owner-income groups.
The distinction is not academic. Earnings attributable to assets, contracts and documented process transfer at closing, because the buyer acquires the thing producing them. Earnings attributable to one person's relationships, judgment and reputation may not transfer at all, because the buyer acquires an entity that person is leaving.
Standard diligence contains no line item separating the two. The adjustment most commonly used to approximate it. A replacement salary. Implicitly assumes the second category is small enough to be covered by a hiring cost. Until this study there was no clean way to test that assumption at scale on privately held firms, because the counterfactual is unobservable. A business cannot be run twice, once with its owner and once without.
Unless something removes the owner for reasons unrelated to the business.
What is the natural experiment behind these numbers?
The study uses premature owner death as an exogenous shock to a firm's stock of human capital, then compares the affected firms to closely matched firms that experienced no such shock.
Constructing the owner-death sample
A firm-owner-year observation enters the sample when four conditions hold. The owner was 64 or younger at the end of year t. The owner held at least 20% of the firm in t−1. The owner reported over $1 million in fiscal income in t−1. And the owner died in year t, within the window 2005 to 2010.
The firm itself had to be a going concern: at least $100,000 in sales in t−1, positive sales across the full window t−4 through t−1, and positive employment in at least one year of that window. Firms where any other owner died between 2001 and 2014 were excluded, so the estimate reflects a single shock rather than a compound one.
Owner year of death comes from Social Security Administration files housed alongside the tax records, which is what makes the event observable at all.
The matching procedure
Each qualifying firm-owner-year observation was matched to all counterfactual observations satisfying the same going-concern criteria, where the firm never had an owner die in the year of or immediately after being an owner, and where the observation matched the owner-death observation along five dimensions. Those include the same five-year owner age bin, the same fiscal-income bin (99th to 99.5th percentile, 99.5th to 99.9th, or top 0.1%), and the same three-digit NAICS industry code.
This matters more than it might appear. The comparison is not owner-death firms against firms in general. It is owner-death firms against the nearest available twin the tax data could construct , same industry, same size profile, same owner demographics, same year. Whatever secular trend was affecting mid-market professional services firms in 2008 was affecting both groups.
The top 1% sample comprises 2,609,973 observations across 2,436 owner-death firms. The baseline specification is equal-weighted; the authors note that dollar-weighted approaches deliver similar estimates with wider standard errors.
The second experiment: owner retirement
The paper runs a parallel design on owner retirement, inferred rather than observed. A firm is classified as experiencing an owner retirement when it transitions from four consecutive years of paying at least one owner W-2 wages to two years of paying none.
The stated presumption is that such owners replaced themselves with non-owner managers whose compensation is reported entirely as wages and bonuses rather than as profits.
That design deserves particular attention from anyone building an add-back schedule, because it is the replacement-manager assumption run as an experiment by the owners themselves. Profits at owner-retirement firms tracked matched firms closely through the pre-period, then fell immediately and persistently.
What did the experiments measure?
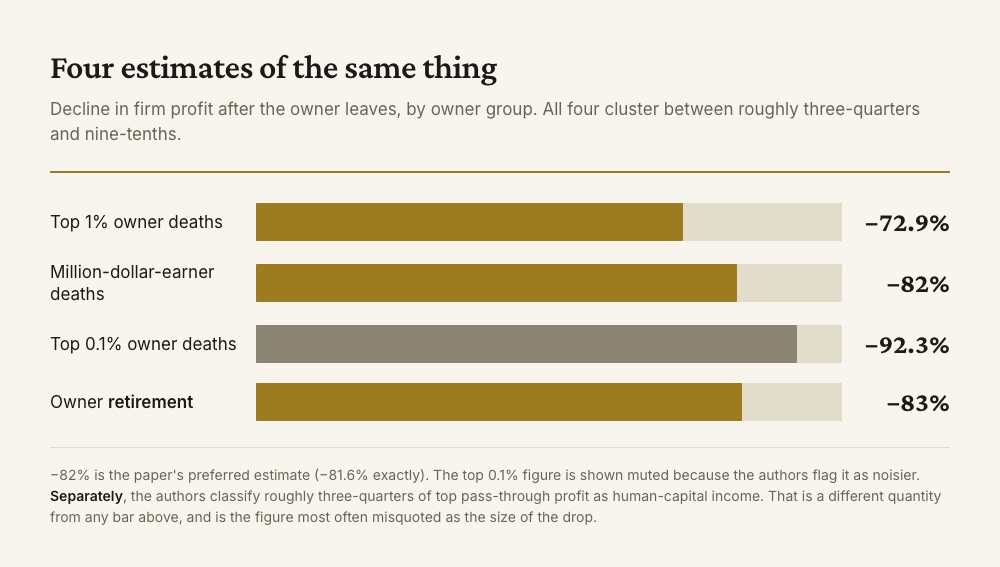
| Event | Profit impact |
|---|---|
| Top 1% owner deaths | −72.9% |
| Million-dollar-earner deaths | −82% (preferred estimate, −81.6%) |
| Top 0.1% owner deaths | −92.3% (authors note this is noisier) |
| Owner retirement | −83% |
Four estimates of the same underlying quantity, arrived at through two different research designs and three different owner-income strata, clustering between roughly three-quarters and nine-tenths of profit. The convergence is what makes the result difficult to dismiss as an artifact of any one specification.
A correction worth making explicitly
The figure most often repeated from this paper is 75%, and it is the wrong number to attach to the decline.
Three-quarters is real, it is in the paper, and it is the authors' conclusion about what share of top pass-through profit constitutes a return to human capital. A conclusion reached by averaging effects across the three owner groups. It is not the magnitude of any measured decline.
The decline is 82%.
Does the damage show up as thinner margins or as failure?
Overwhelmingly as failure, and this is the finding most often lost in summaries of the paper.
The effect decomposes into an extensive margin. Whether the firm continues to exist. And an intensive margin. What firms that survive go on to earn. Nearly all of the damage sits in the first.
An owner's death made the firm 19.8 percentage points less likely to survive four years, with a t-statistic of 11.6. Among firms that did survive to t+4, profit fell $13,252, with a t-statistic of 1.9. Marginally significant, and small relative to the firms in question.
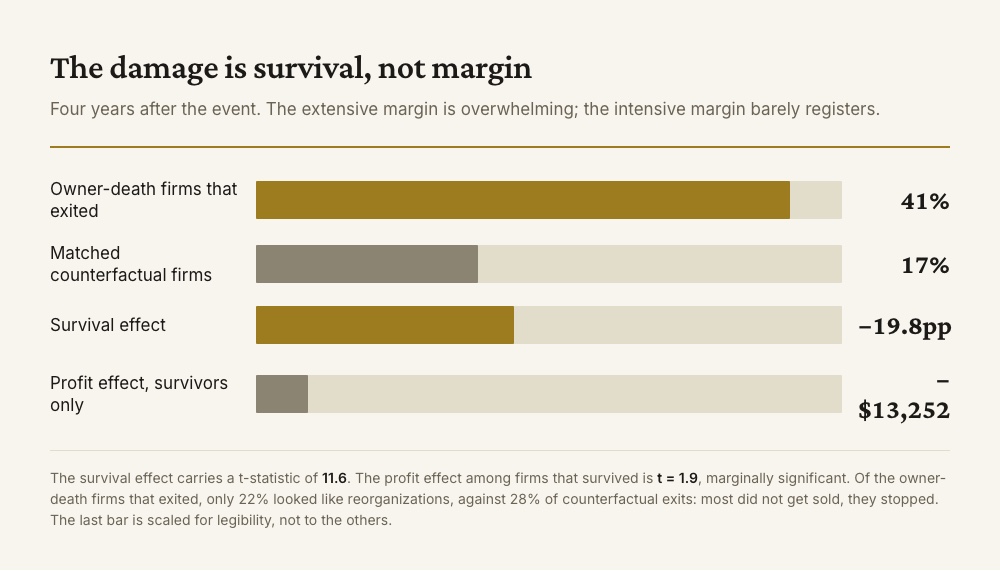
Forty-one percent of owner-death firms exited between the event year and four years later, against 17% of matched counterfactuals.
Were the exits sales?
Mostly not, and the authors tested it rather than assuming.
Exit from the tax sample does not automatically mean a business shut down. It can also mean reorganization under a different employer identification number, through bankruptcy or through sale. To separate the two, the authors identified, for each firm with zero sales in t+4, the largest single employer other than the exiting firm across the two years following its first fully exited year, among the firm's workers from the year before exit, excluding the dying owner. Where that employer absorbed more than half the workforce, the exit was classified as a reorganization.
Only 22% of exiting owner-death firms met that test, against 28% of exiting counterfactual firms.
Owner-death firms were therefore slightly less likely to have been sold or reorganized than the comparison group. The elevated exit rate reflects businesses stopping, not businesses changing hands.
Why this reframes the underwriting question
For a buyer, and more sharply for a lender, this changes what the exposure is.
Margin compression is a manageable risk. It shows up in coverage ratios, it can be modelled, and it is survivable through a covenant reset. A twenty-point shift in whether the borrower exists in four years is a different instrument of harm. It does not appear anywhere in a debt-service calculation built on trailing earnings, because that calculation assumes an entity to service the debt.
The practical form of the question is not "how much would earnings fall without this owner." It is "what is the probability there is still a business here in year four, and what in the file speaks to that."
How does this compare to a replacement-salary add-back?
A $200,000 replacement manager applied against $1.2M of EBITDA implies the owner accounts for roughly 17% of profit. The measured experiments imply 82–83%. The two approaches differ by close to an order of magnitude on the same individual.
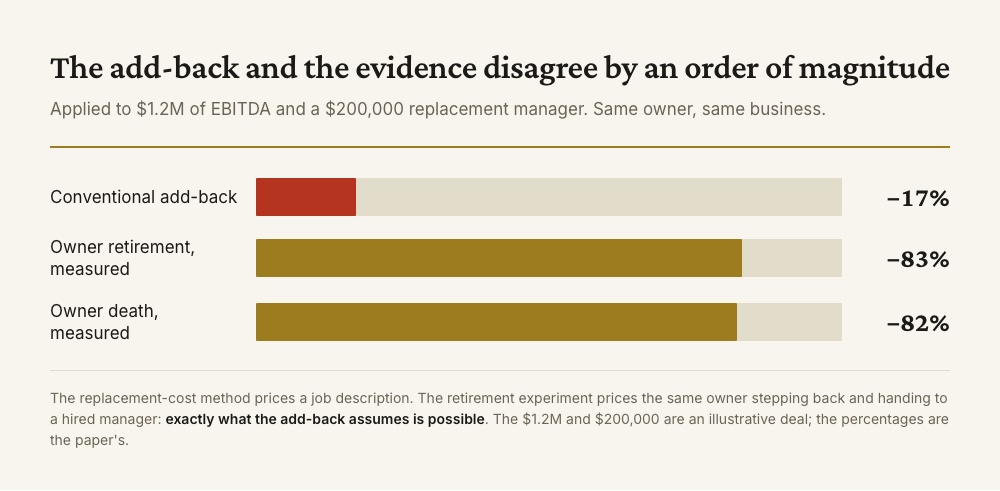
The dollar figures in that comparison are illustrative. The percentages are the paper's.
A worked example
Consider a business presenting $1.2M of EBITDA, where the owner draws $80,000 and the market rate for a general manager performing the visible duties is $200,000.
The conventional treatment. Add back the $80,000 owner salary, deduct a $200,000 replacement, and report adjusted EBITDA of $1.08M. Some practitioners would stop at $1.0M for conservatism. At a 4× multiple this is a business worth somewhere between $4.0M and $4.3M, and the owner adjustment has moved the valuation by roughly $500,000.
What the retirement experiment implies. Owners who performed exactly this substitution. Who stepped back and handed operations to a hired manager. Saw profit fall 83%. Applied naively, the same $1.2M would settle near $200,000. At the same multiple that is a business worth $800,000.
Neither number is the answer. The naive application is wrong because the study measures average outcomes across firms with widely varying degrees of owner-concentration, and because it covers substantially larger businesses. But the distance between $4.3M and $800,000 is the size of the uncertainty that the current method resolves by assumption rather than by evidence.
The useful conclusion is narrower and more actionable: the replacement-salary adjustment is not a measurement, it is a hypothesis. That a hire recovers the owner's contribution. The evidence says that hypothesis fails far more often than the adjustment implies. It should therefore be tested in diligence rather than asserted in a schedule.
What actually leaves with the owner
The replacement-cost method prices a role, and roles are the part that is easiest to see. What the tax record indicates departs is broader and less visible:
- Customer relationships held personally, where the buying decision follows the individual rather than the entity
- Supplier terms extended on tenure, which reprice when the relationship ends and surface as a working-capital problem months after close
- Undocumented pricing judgment. The discretion about what to charge which customer, which in owner-run businesses typically lives in one head and constitutes a genuine earnings driver
- Staff retention attached to the individual, particularly among senior operators who joined because of the owner
- Credit relationships, where a personal guarantee or a banking history is doing more work than the balance sheet
- Reputation that wins work before a bid is submitted, which is invisible in a win-rate analysis because the lost bids were never solicited
None of these carries a salary line. That is the structural reason a schedule built from the payroll register cannot see them, and it is why the omission is systematic rather than occasional.
Buyers working through how to verify a seller's growth story encounter a structurally similar problem: the reported figure is accurate, and the attribution behind it is what is contested.
Does this research apply to Main Street businesses?
Not directly, and this is the binding limitation.
Every owner in the sample reported over $1 million in fiscal income. The three groups are the top 1%, million-dollar earners, and the top 0.1%. A typical financed acquisition is substantially smaller. No equivalent study has been run on that population, and anyone claiming this paper measured Main Street businesses has not read its sample definition.
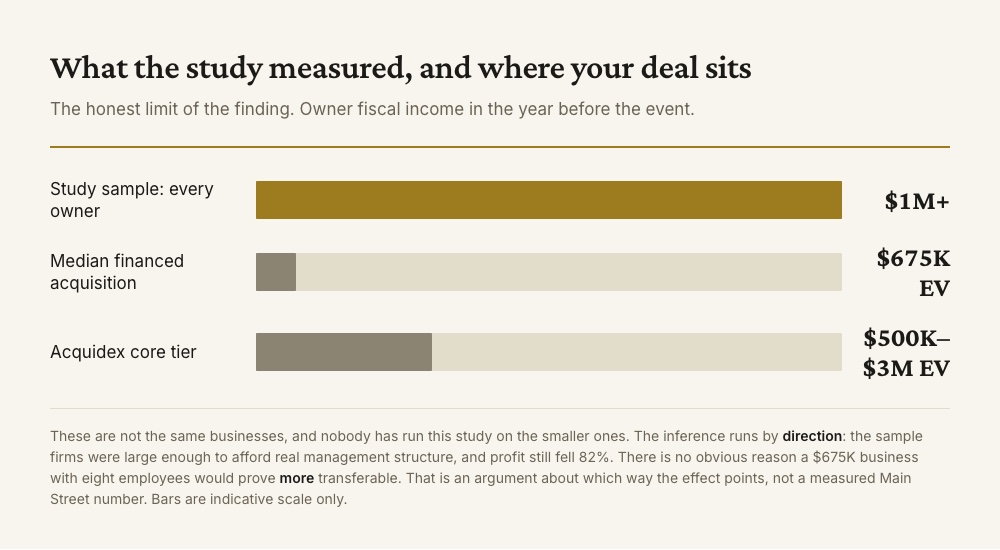
The available inference runs by direction rather than magnitude, and it runs the uncomfortable way. The sampled firms were large enough to support genuine management structure. Second-tier operators, documented process, systems that exist independently of any one person. Profit still fell 82%.
There is no apparent mechanism by which a smaller business, with fewer employees and a higher concentration of institutional knowledge in the founder, would prove more transferable than a firm whose owner clears seven figures. The direction of the bias, if anything, points the other way.
That is an argument about sign, not size, and it should not be quoted as a measured figure for smaller businesses. The honest statement is that the effect is very unlikely to be smaller, and nobody has measured how much larger it might be.
The adjacent question of which businesses transact at all is treated separately in closure rates by industry, where the ratio of closures to sales ranges from 0.8 to above 9 depending on sector. Itself a proxy for how transferable a category tends to be.
Why does the replacement-salary method persist?
If the method understates the owner by an order of magnitude, its survival needs explaining. Three reasons account for most of it, and none is incompetence.
It is the only version of the question with an observable price. A general manager's compensation is quotable from salary surveys, verifiable against a job posting, and defensible to a credit committee. The residual. What the owner contributes beyond the role. Has no market reference at all. When one component of an adjustment is precisely measurable and the other is not, practice gravitates toward the measurable one and treats the remainder as zero. That is a reporting convention hardening into an analytical claim.
It is symmetric across the table, so nobody has to defend it. The seller's adviser and the buyer's adviser generally agree on the method and negotiate the input. An argument about whether $180,000 or $220,000 is the right manager cost is tractable and gets settled. An argument about whether the entire framework understates the adjustment by sixty points is not tractable inside a transaction timeline, and neither side is incentivised to open it. The method persists partly because it produces disputes that can be closed.
The failure is invisible in the data practitioners see. A buyer who overpays for owner-dependence does not discover it at closing. The consequence arrives one to four years later as underperformance or as a business that quietly stops, by which point it is attributed to execution, to the market, or to the buyer. The feedback loop that would discipline the method runs longer than most people's memory of the deal that caused it, and nobody is assembling the counterfactual. That is precisely the gap a study on eleven million firms fills: it constructs the comparison that individual experience cannot.
The implication is not that the method should be discarded. It is that its output should be labelled as what it is. A floor on the owner adjustment, derived from the one component with a market price. Rather than as an estimate of the whole.
What does this mean for an owner preparing to sell?
The study is usually read from the buy side. Read from the other direction it is a more actionable document, because the variable it identifies is one a seller can change and most of the variables that determine a multiple are not.
An owner cannot readily change their industry's closure-to-sale ratio, the prevailing multiple in their category, or the credit conditions in the year they go to market. They can change how much of the business runs through them, and the evidence suggests that variable carries more weight than it is usually assigned.
Three observations follow from the design of the study rather than from opinion.
The work is slow and invisible in trailing financials. Transferring customer relationships, documenting pricing logic, and building a second tier of operators takes years and shows up in the P&L as cost before it shows up as anything else. An owner who begins that work eighteen months before a sale is unlikely to complete it. This is the structural reason so few businesses arrive at market genuinely transferable: the preparation window that would matter is longer than the one sellers typically use.
Margin and transferability can move in opposite directions. The businesses that look most attractive on a summary. High margin, low overhead, long customer tenure, minimal management layer. Often achieve those characteristics precisely by concentrating function in the owner. A second-tier hire reduces margin in year one and increases transferability thereafter. A seller optimising the appearance of the financials in the year before a sale may be actively reducing what the business is worth to a buyer who underwrites continuity.
The retirement experiment is the relevant one for planning purposes. It measures owners who stepped back to a hired manager rather than owners who died, and its result was marginally worse than the death case at 83%. That is not an argument against succession planning. It is an argument that installing a manager is the beginning of the transfer rather than the completion of it, and that the interval between the hire and the handover of relationships is where the value is either preserved or lost.
For advisers working with sellers, the practical version is a timeline question rather than a valuation question: how long before a sale did this owner begin transferring the things that have no salary line, and what evidence exists that the transfer took. The closure-rate data by industry suggests how much that work is worth in categories where most businesses never transact at all.
What should diligence do differently?
The study does not prescribe a procedure. What follows is the practical translation, and it is offered as such.
Separate the two questions the add-back conflates. What would it cost to hire someone to perform the owner's visible duties, and what proportion of earnings depends on relationships and judgment that a hire does not acquire. The first has a market price. The second requires evidence from the business.
Test the replacement hypothesis before closing rather than after. If the schedule assumes a $200,000 manager restores the owner's contribution, that person can be identified and, in many transactions, installed during the pre-close period while the seller remains available. An adjustment that cannot survive being named and tested is an assumption carried at full value.
Establish who holds each significant customer relationship, independently of who services it. The operative question is not who manages the account but who the customer would contact when something goes wrong outside business hours. Where the answer is the seller across the top five accounts, the concentration is in a person rather than in a customer list.
Look for a period when the business ran without the owner. An extended absence. Three consecutive weeks or more, without daily contact. Is the closest thing to a natural experiment available inside a single company. What broke, who resolved it, and whether revenue moved are observable facts, and an owner who has never been absent that long has disclosed something the schedule will not.
Verify supplier terms with the supplier. Trade credit extended on a long personal relationship is a real economic benefit that may not survive the transfer, and it appears post-close as a working-capital variance rather than as a transferability finding.
For lenders, add a continuity question to the credit file. Where earnings are substantially owner-derived, the material risk is not coverage compression but borrower survival, and the survival result in this paper is far stronger than the margin result. A file that documents coverage but says nothing about who holds the customer relationships has not addressed the larger of the two.
What are the limitations of this evidence?
- Sample income. High-income owners only. This is the binding constraint and it is stated above.
- Data window. Deaths occur between 2005 and 2010, spanning the financial crisis. The design matches on year, so internal comparisons hold, but norms in small-business management may have shifted in the intervening period.
- Retirement is inferred, not observed. A firm that ceases paying owner wages may reflect restructured compensation, a quiet sale, or an owner's illness. These are not equivalent events, and the proxy captures all of them.
- Profits are tax profits. Pass-through profit as reported is a tax construct, and owners have well-documented incentives to shift income between wages and profits. A substantial portion of what the paper investigates. The declines describe a reported quantity, not a cash-flow measurement.
- Exit is inferred from the tax sample. The reorganization test is careful, but a private sale that thoroughly restructures the workforce could in principle be misclassified as a closure.
- Averages conceal variance. Some firms in the distribution presumably lost little, because their earnings were genuinely transferable. The paper offers no method for identifying those firms in advance, and neither does anything else currently available.
That last gap defines the open question. The evidence establishes that owner-dependence is systematically underpriced. It does not establish which businesses are the exceptions, and that is the more useful thing to know.
Does other evidence point the same way?
One study, however large, is one study. The most relevant corroboration comes from a different country and a different data system: Becker and Hvide examined founder deaths in the Norwegian business registry and found reduced survival and growth among affected firms, with subsequent sales and assets at larger startups materially below their controls.
That finding is directionally consistent, and its independence matters. A different population, a different registry, a different research team, arriving at the same qualitative conclusion that founder human capital is not readily substitutable.
It is cited here as context rather than as support, because it has not been verified against its source to the standard applied to the primary study on this page. Every figure attributed to Smith, Yagan, Zidar and Zwick above was read from the published paper text. The Norwegian result has not been, and it is flagged as such rather than quoted with a number. Other studies in this series are indexed on the research hub, where the verification standard for each is stated.
The broader caution is that the effect is well evidenced in direction and poorly evidenced in magnitude for any specific business. Neither this paper nor its corroboration tells a buyer what the number is for the company in front of them.
Methodology and sources
Matthew Smith, Danny Yagan, Owen Zidar and Eric Zwick, Capitalists in the Twenty-First Century, Quarterly Journal of Economics 134(4), November 2019, pages 1675 to 1745. The figures on this page were read from the author-hosted full text of the paper (PDF). An earlier working-paper version is NBER Working Paper 25442; note that it reports a smaller top-1% owner-death estimate than the published article, which is the version used here.
All figures on this page were read from the published paper text on 30 August 2026, not from an abstract or a secondary summary. That verification was prompted by discovering that a working headline for the companion article quoted a statistic the paper does not make in the way the headline used it; the verification record is published alongside this piece.
The illustrative deal figures, $1.2M of EBITDA, a $200,000 replacement manager, a 4× multiple , are constructed for the worked example and are not drawn from the study.
Author: Avery Hastings, CPA. This is analysis of published research. It is not a report of engagements conducted by the author.

Avery Hastings, CPA
Founder, Acquidex • CPA • Tokyo, Japan
Avery Hastings is a CPA based in Tokyo, Japan and the founder of Acquidex. She focuses on helping buyers evaluate small-business deals with clear cash-flow logic, realistic downside analysis, and practical diligence frameworks.
Keep up with Avery →Sources
Keep Reading
- The Four Risks That Decide Whether an Acquisition Works11 min read read
Most SMB and lower-middle-market deals don't fail on strategy. They fail because four risks — overstated cash flow, customer concentration, owner dependency, and aggressive leverage — were each judged manageable in isolation, then compounded after close.
- How to Verify a Seller's Growth Story: Four Checks, and Why Two Designs Disagreed24 min read read
I tested whether hailstorms grow roofing companies. Compared across counties the effect was geography. Compared to itself, each county gained three points. A seller only ever shows you one of those.
- I'd Rather Find a $500,000 Problem Than a $417 Lie16 min read read
A problem changes the price. A lie changes the reliability of everything you were told, including the things that made you want the business. Diligence is a sampling exercise, and that is the whole reason the difference matters.