


Key Insight
Most small businesses end by closing rather than selling, and which side of that line a business falls on is decided by transferability rather than by profit, size, or quality of management. Census Annual Business Survey data across 104 industries shows legal services recording 9.0 closures for every one sale, residential building construction 7.7, general freight trucking 7.6, specialty trade contractors 5.4. At the other end, hotels and motels record 0.7, offices of dentists 0.8, grocery stores 1.0 and gasoline stations 1.1 — the first two selling more often than they close, the rest at or near parity. A law practice is roughly thirteen times more likely to end in closure rather than sale than a motel is, despite typically out-earning it. The clearest natural experiment in the file is dentists at 0.8 against physicians at 3.0: identical training, opposite outcomes, because a dental practice is a fixed location with financeable equipment and a recurring hygiene schedule while a physician's practice is largely the physician. Four factors decide it — a place customers come to, physical assets a lender can value, a license attached to the site rather than the person, and customers contracted to the company rather than known personally to the owner. This matters because 2,336,751 American business owners are 55 or older, 52.6% of all owners, and the businesses least likely to reach the market are concentrated in the trades and owner-operated professional services. The survey samples current business owners, so the absolute ratio overstates the population rate and should not be quoted as one; the between-industry comparison is the defensible finding.
A word on scope
Every figure here comes from one source: the US Census Bureau's Annual Business Survey 2021, Characteristics of Business Owners, question O15. I downloaded the bulk file and recomputed everything on 9 August 2026. Establishment counts used for cross-checking come from County Business Patterns 2023. Both are free bulk downloads and neither requires an API key.
This piece is a direct follow-up to The Silver Tsunami Is Real. Most of Its Supply Won't Transfer., published in June. That analysis leaned on the Exit Planning Institute's sell-through estimate and on Japanese succession data, and it carried a limitation I stated at the time: no public database tracks small business acquisition outcomes cleanly by industry. The 20 to 30 percent figure everyone repeats is a widely cited estimate, not a national census.
This is that database. It does not replace the June analysis; it answers the question that piece could not, which is which businesses fail to transfer rather than simply that most of them do.
The honest limitation, stated up front rather than buried: everyone answering this survey is a current business owner, so anyone who exited and stayed out is invisible. The absolute closure ratio is therefore not a population estimate and should never be quoted as one. The between-industry comparison is what holds, because the same filter applies to every column. Full method at the end.
Why has nobody run this before?
The Annual Business Survey is not obscure. The Census Bureau runs it every year, it covers employer businesses nationwide, and the file is a free download. It is used constantly for owner demographics: how many businesses are owned by women, by veterans, by immigrants.
Almost nobody uses question O15.
O15 asks an owner whether they owned a different business before this one, and if so what became of it. The answer options are plain: it is still operating and I still own it; it is no longer in operation; it was purchased by another individual; it was purchased by another company.
That is the only place in public data where you can watch American small businesses actually end. Not the asking price. Not the listing. Not a survey of brokers about what they believe is happening in their market. The recorded outcome, from the owner, after the fact.
The reason it goes unused is probably that it answers a question the industry does not ask. Brokerage data describes businesses that came to market. This describes the ones that did not.
What happens to a business when the owner stops?
The Annual Business Survey is not obscure. Census runs it every year, it covers every employer business in the country, and the microdata is a free download. People use it constantly for owner demographics.
Almost nobody uses question O15.
Question O15 asks a business owner whether they owned a different business before this one. If yes, it asks what became of that earlier business. It is still operating and I still own it. It is no longer in operation. It was purchased by another individual. It was purchased by another company.
That last pair, set against the second option, is the only place in public data where you can observe the end state of American small businesses at scale. Not the asking price. Not the listing. Not a survey of brokers about what they think is happening. The actual disposition.
The 2021 file records 4,358,791 owners answering it. (Chart components sum to 4,358,797; Census rounds cells independently.)
| Disposition of the owner's previous business | Owners | Share |
|---|---|---|
| This is the owner's first business | 2,152,454 | 49.4% |
| Still operating, still owned by them | 1,537,896 | 35.3% |
| No longer in operation | 388,252 | 8.9% |
| Other | 136,465 | 3.1% |
| Purchased by another individual | 75,622 | 1.7% |
| Purchased by another company | 68,108 | 1.6% |
Roughly half of American business owners are on their first business. Of the half who are not, most still hold the earlier one. The interesting rows are the last four, which describe businesses that left their original owner's hands.
Closed: 388,252. Sold: 143,730.
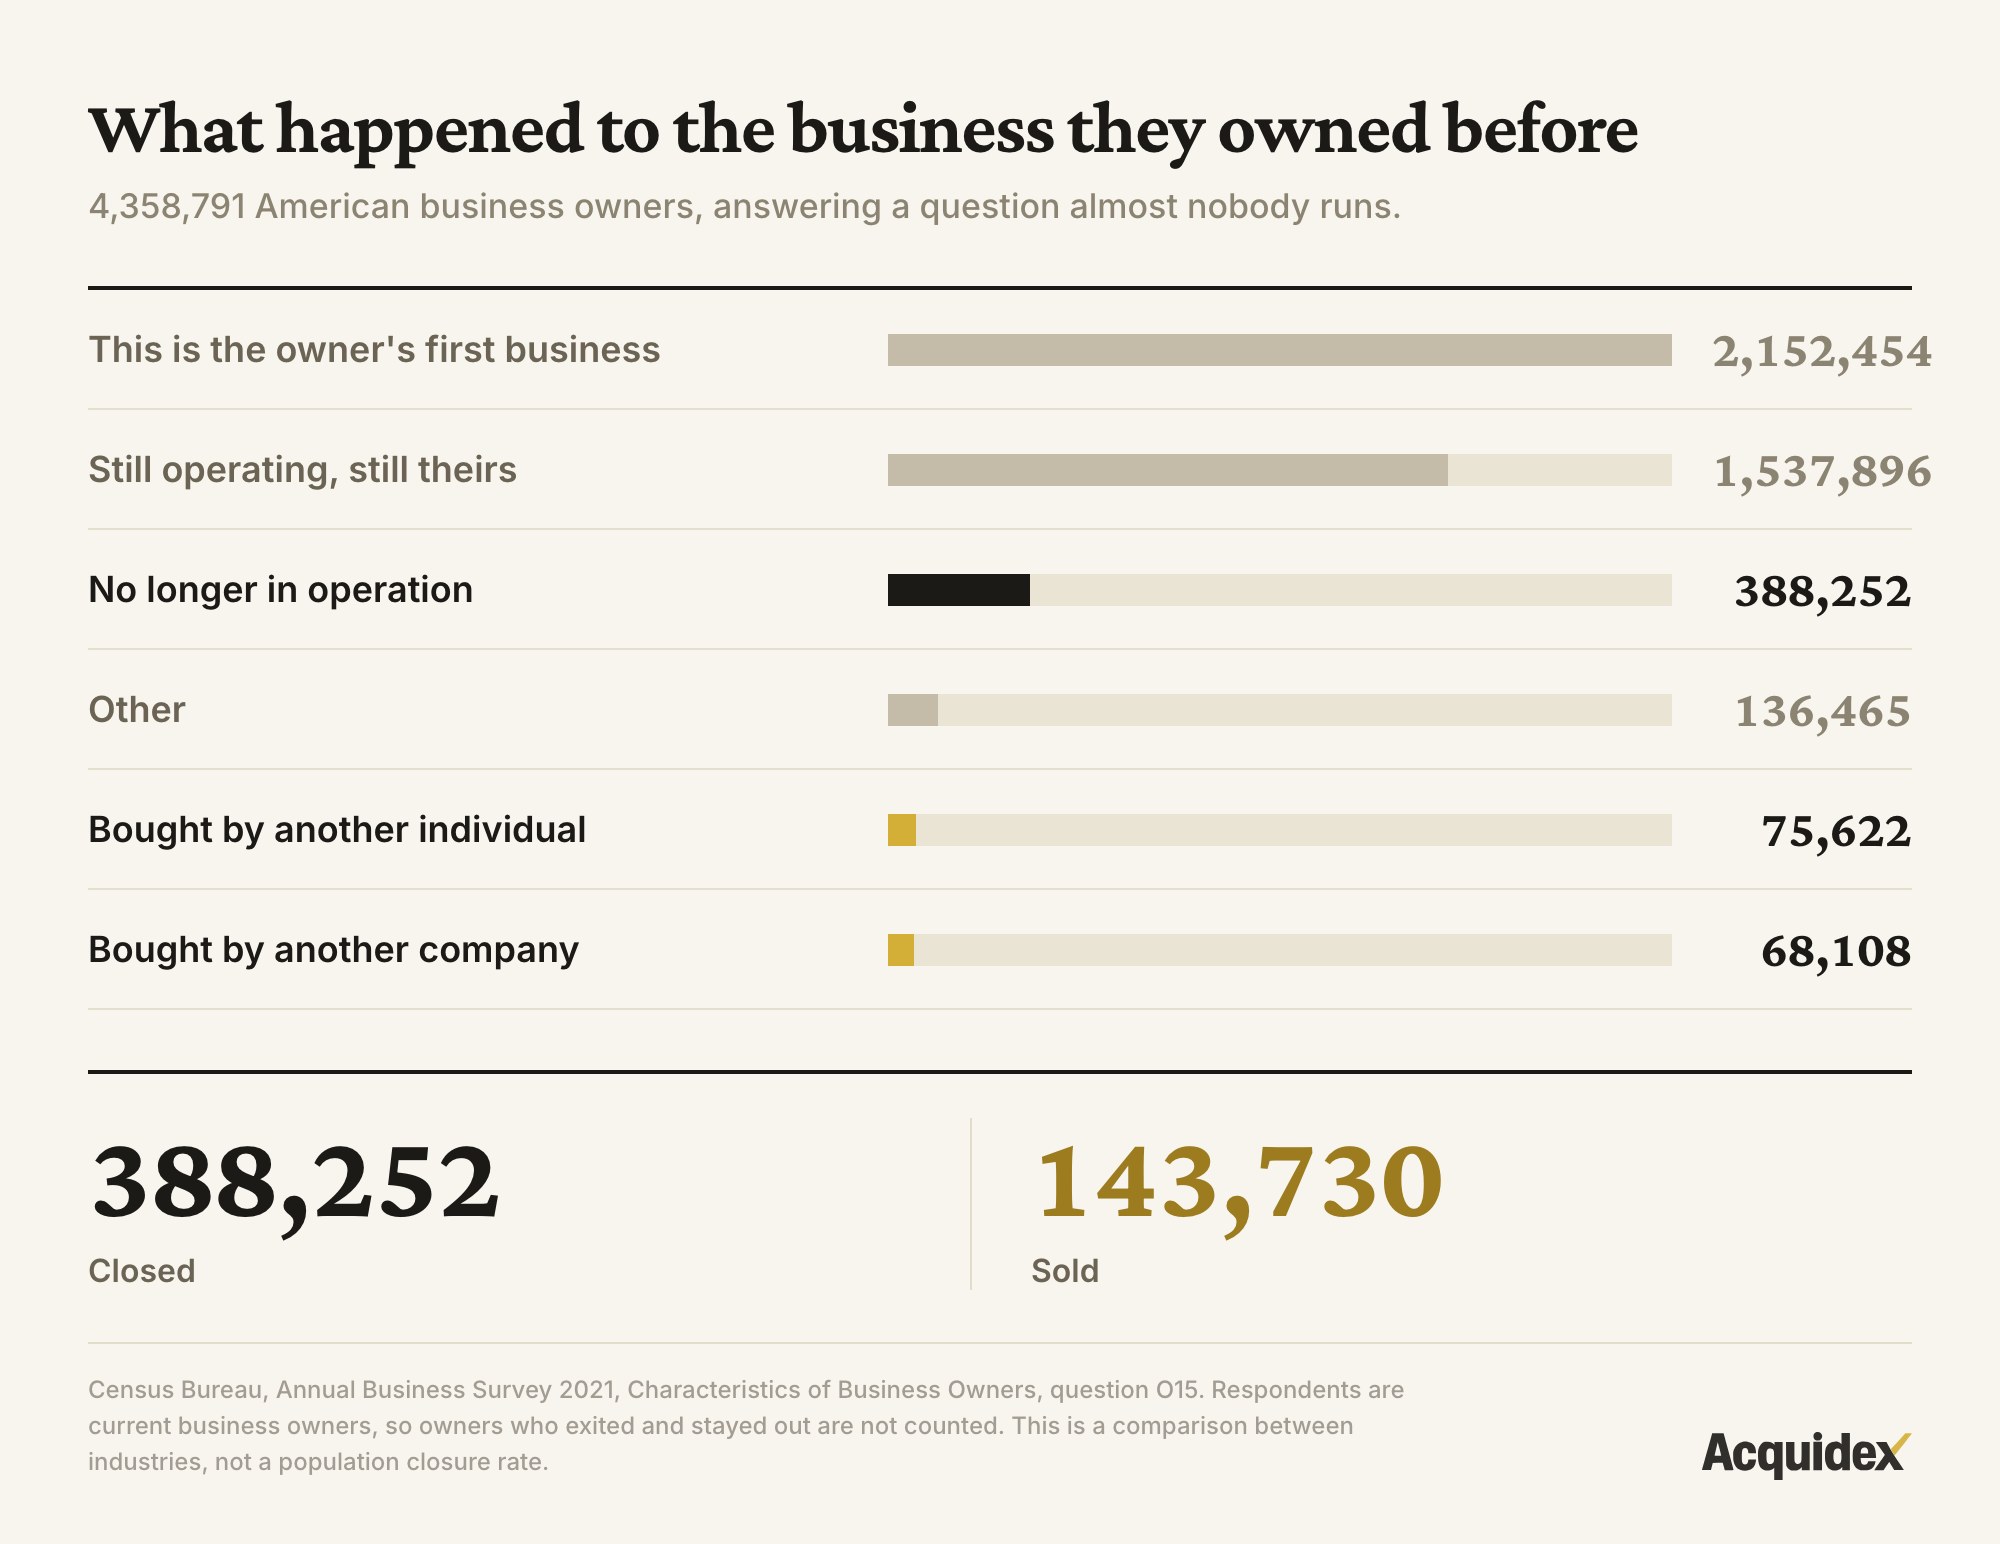
Census question O15 is the only public series recording what actually became of a small business, rather than what it was listed for. Among 4.36 million owners, 388,252 report a previous business that closed against 143,730 that sold. The headline ratio is roughly three to one, but the sample is current owners only, so it describes serial entrepreneurs rather than the whole market. The finding that survives is the spread between industries.
Why shouldn't the headline ratio be quoted?
Because the sample has a problem that anyone working with survey data will spot, and it is better raised here than found later.
Everyone answering this question is a current business owner. That is who the survey surveys. So the file captures a person who closed a business and then started another one, and a person who sold a business and then started another one. It does not capture anyone who left and stayed gone.
Consider who that excludes. The owner who sold a profitable HVAC company at sixty-one and retired on the proceeds — close to the archetypal successful exit, and absent entirely. The owner who closed a failing restaurant and went back to salaried work — also common, also absent.
Both exclusions are large, and they do not obviously cancel. If anything the bias runs toward closure, because starting over is a more common sequel to failure than to a life-changing check.
So three-to-one describes serial owners. It is an upper bound on the closure share, not an estimate of it. Anyone publishing "73 percent of American businesses close" from this table has skipped the documentation.
What survives is the comparison. The selection problem is roughly constant across industries: the lawyer who sold and retired is missing, and so is the dentist who sold and retired. Whatever filter the survey applies, it applies to every column. That makes the between-industry comparison far more robust than the level of any single one.
And the variation is very large.
Which industries sell, and which just close?
Restricting to industries with at least 400 recorded sales and 2,500 total exits, so that thin cells do not drive the ranking, 104 industries qualify. The range runs from 9.0 down to 0.7.
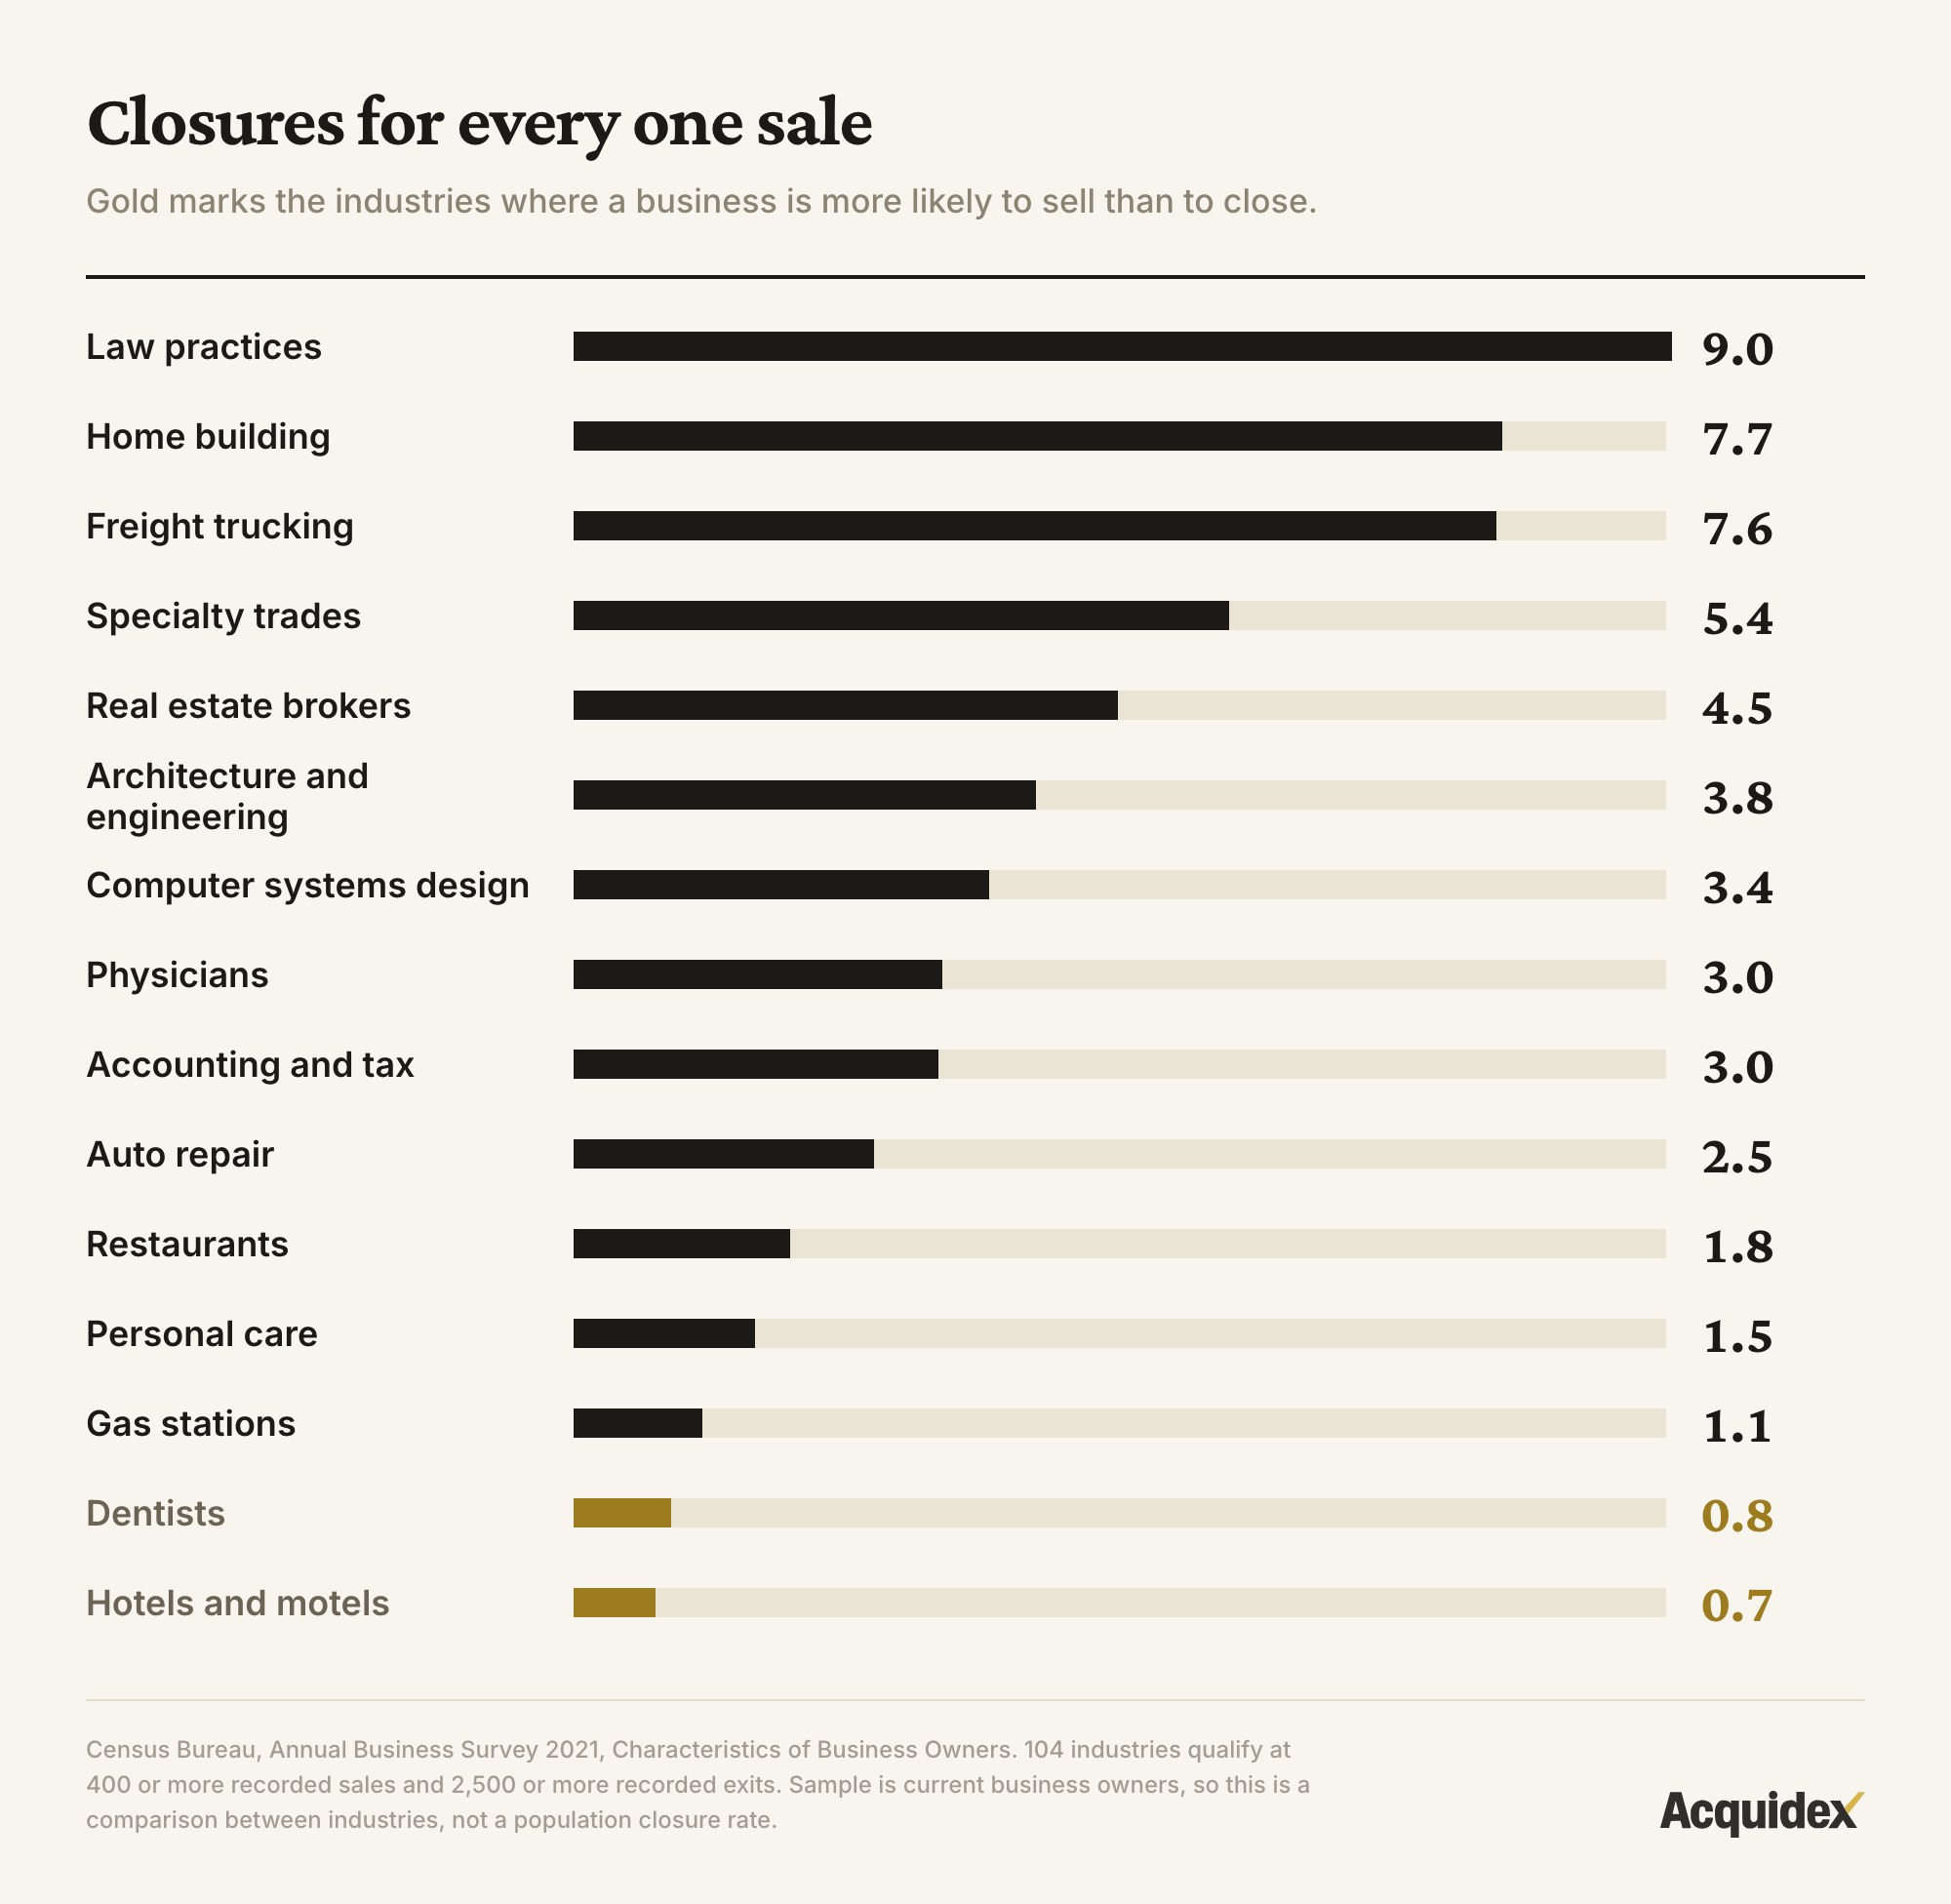
The five where businesses almost never sell:
| Industry | Closed | Sold | Closures per sale |
|---|---|---|---|
| Legal services | 18,929 | 2,095 | 9.0x |
| Residential building construction | 15,998 | 2,090 | 7.7x |
| General freight trucking | 4,441 | 584 | 7.6x |
| Foundation, structure and building exterior contractors | 7,042 | 1,009 | 7.0x |
| Construction of buildings | 20,214 | 2,910 | 6.9x |
The five with the best odds:
| Industry | Closed | Sold | Closures per sale |
|---|---|---|---|
| Traveler accommodation | 2,296 | 3,355 | 0.7x |
| Offices of dentists | 3,710 | 4,641 | 0.8x |
| Grocery stores | 2,335 | 2,244 | 1.0x |
| Gasoline stations | 2,117 | 2,004 | 1.1x |
| Beer, wine and liquor stores | 1,607 | 1,439 | 1.1x |
These are not separated by profitability. A well-run law firm out-earns most motels comfortably. They are not separated by difficulty, or by the owner's competence, or by how much the owner cared. They are separated by whether there is a definable object that continues to exist after the owner stops.
Across 104 industries the ratio runs from 9.0 closures per sale in legal services down to 0.7 in hotels and motels. Construction trades, trucking and real estate brokerage cluster at the top; accommodation, dentistry, groceries, fuel and liquor retail cluster at the bottom, closest to parity between sales and closures. Profitability does not predict position. The presence of a conveyable asset does.
The pattern holds at the sector level
Rolling the 104 industries up to their sectors shows the same ordering, which is what you want to see before trusting an industry-level result. Weighted by the actual counts:
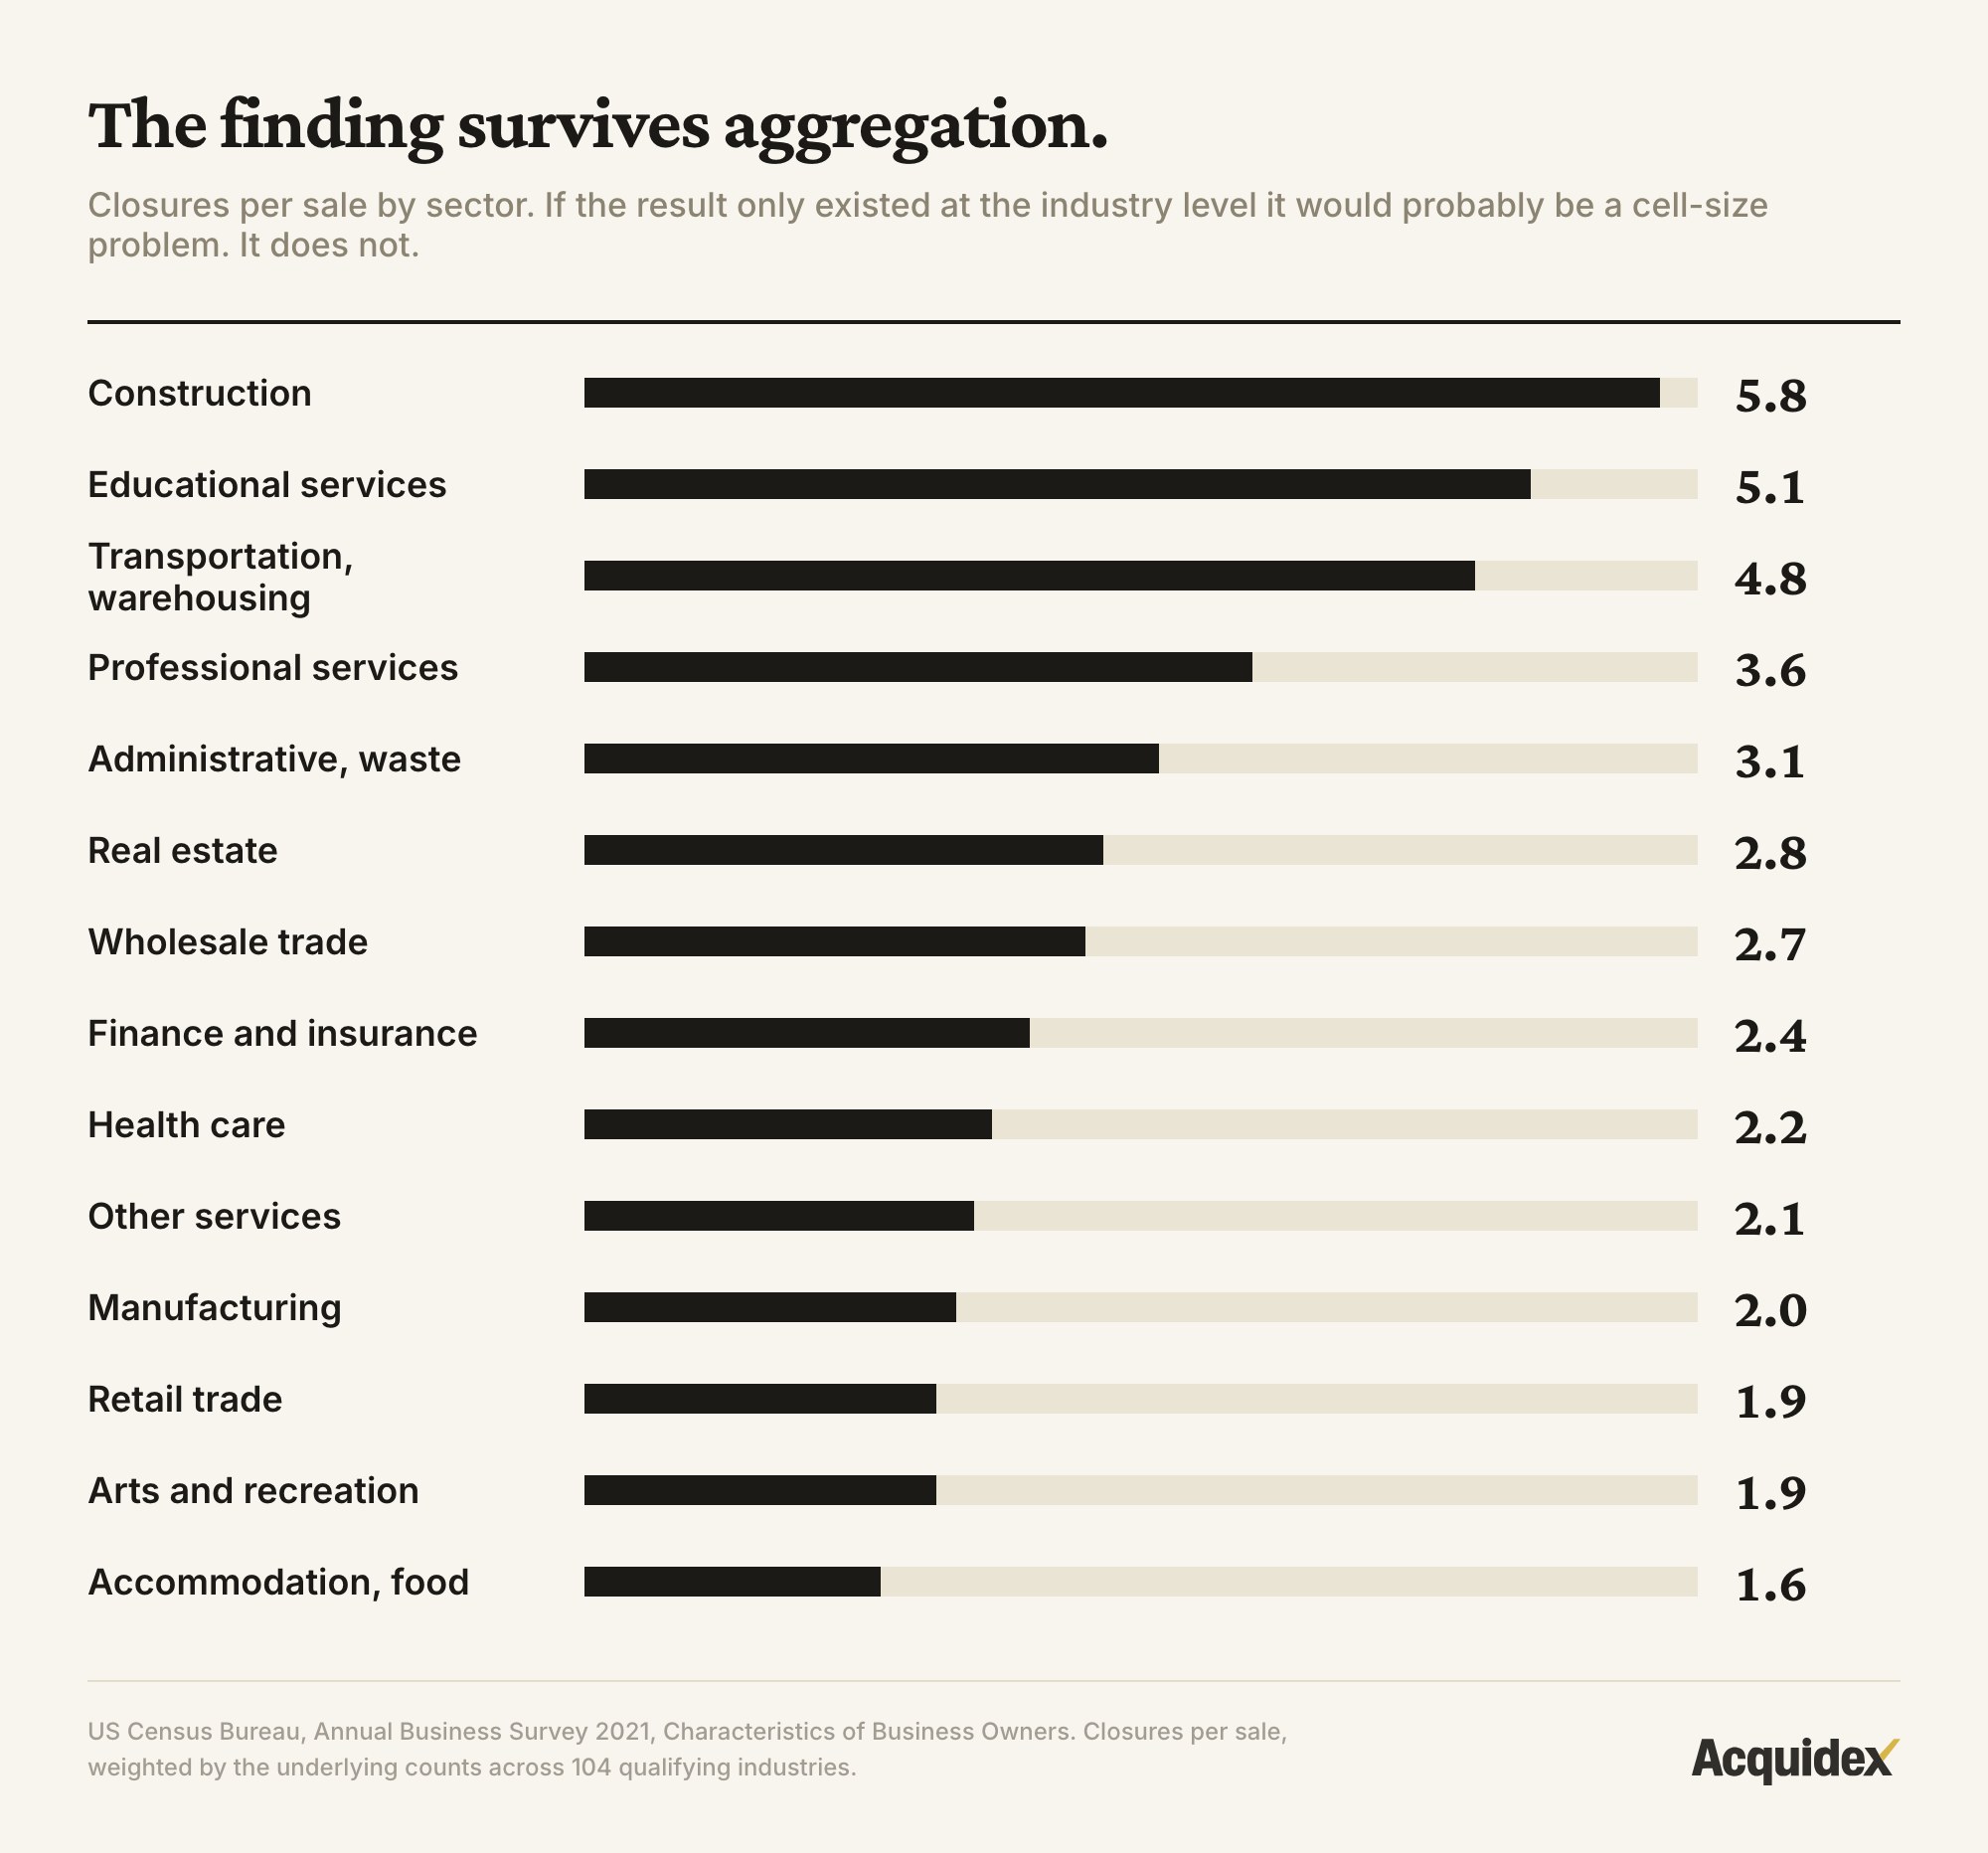
Construction sits worst at 5.8 and retail near the bottom at 1.9. Nothing here depends on a single industry's cell being right, which is the point of showing it: the finding survives aggregation.
Across all 104 qualifying industries the median is 2.6 closures per sale and the mean is 3.0. Thirteen industries sit above 5.0. Twenty-three sit between 1.0 and 2.0. Three are at or below parity.
What makes a business transferable?
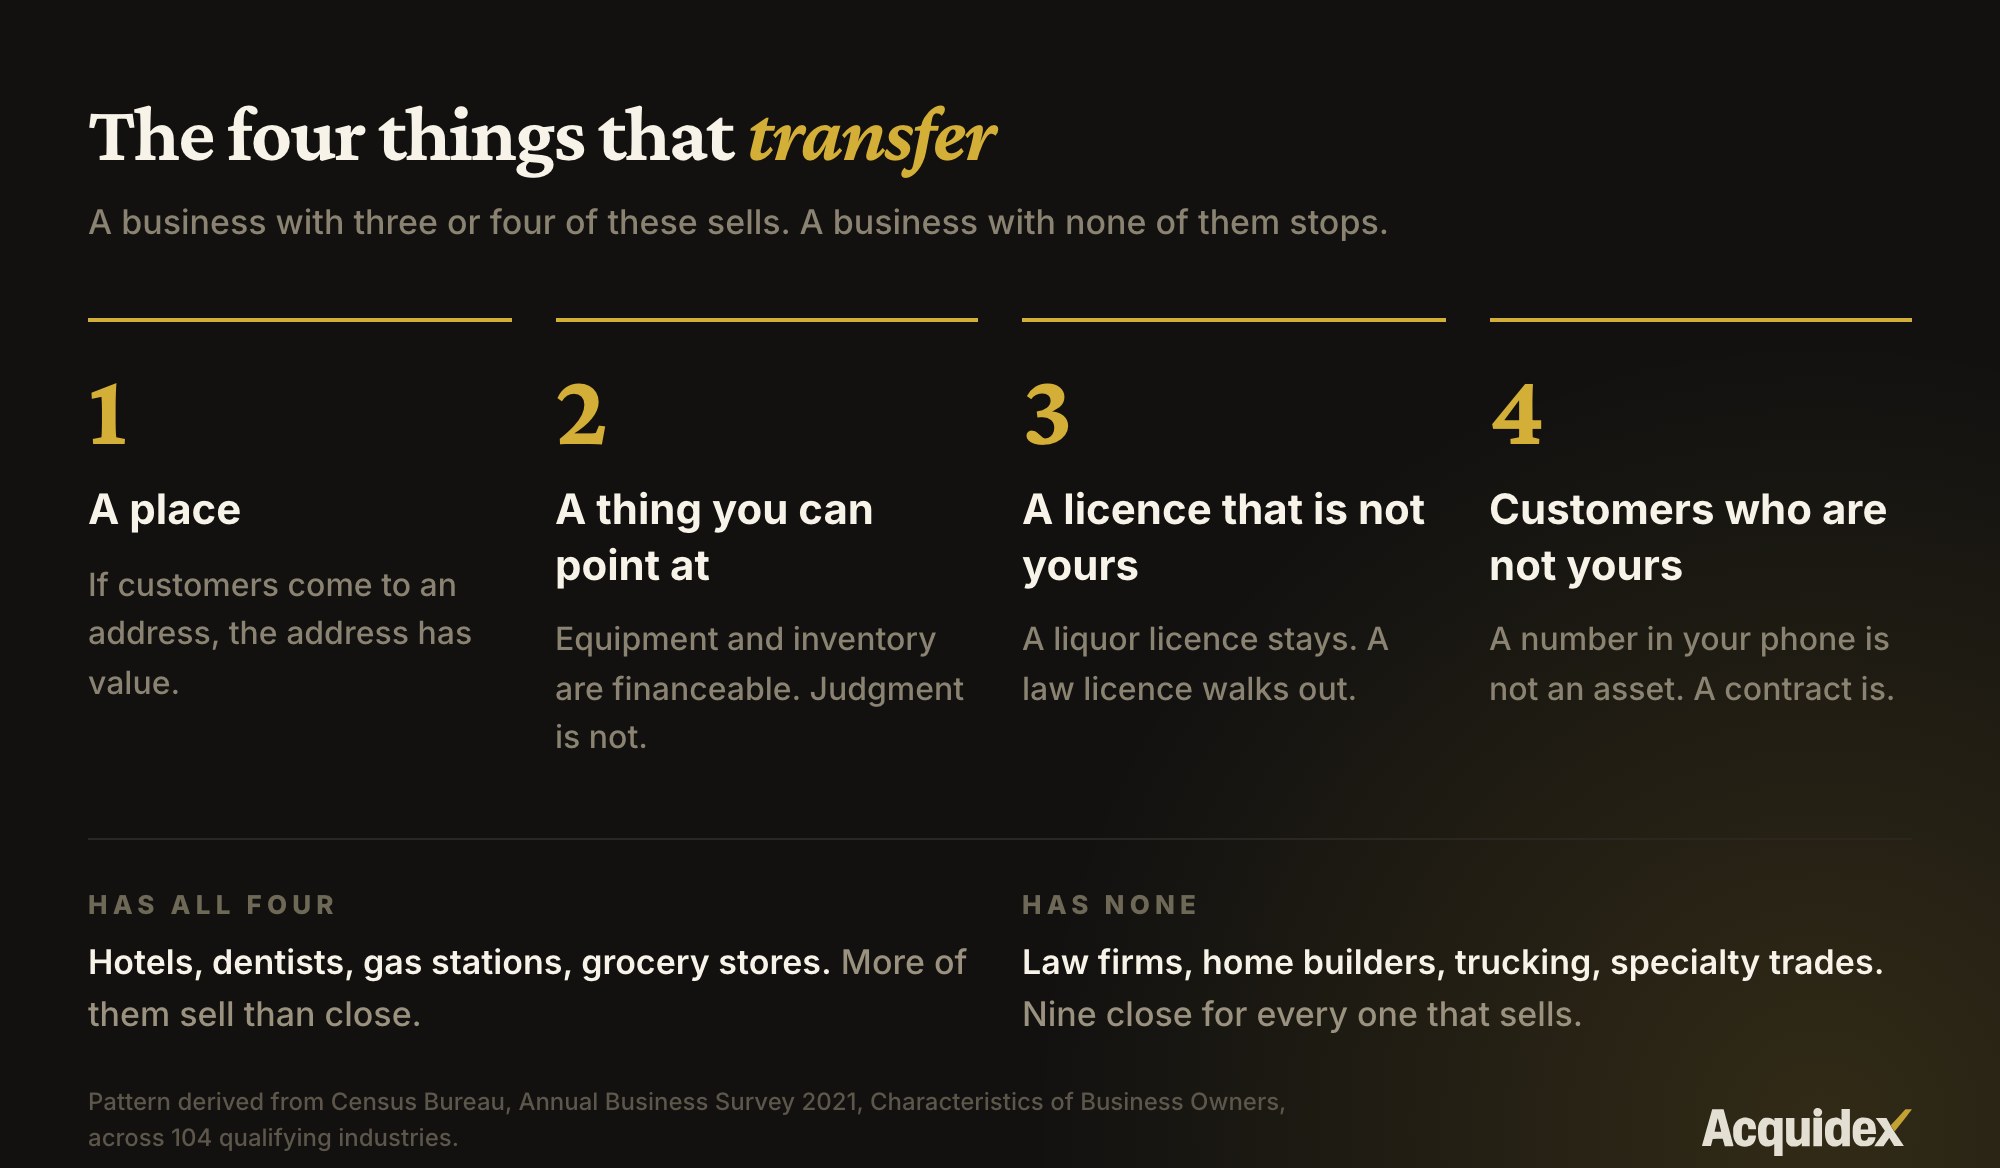
Businesses do not sell because they are good. They sell because something is left when the owner walks out. There are four such things, and a business with three or four of them sells while a business with none of them stops.
A place
If customers come to an address, the address has value. Hotels sell. Gas stations sell. Grocery stores sell. Liquor stores sell.
Nobody picks a gas station because they like the owner. They pick it because it is on the way home, and that indifference is the whole point: the relationship belongs to the corner, not to a person. A general contractor has no address that matters, because the work happens at your house.
There is a lesson here that sits uncomfortably with how owners think about their businesses. The most emotionally satisfying businesses to own are the ones where customers choose you specifically. Those are the hardest to sell.
A thing you can point at
Equipment, inventory and fixtures are financeable. Judgment is not.
A dental practice has chairs bolted to the floor and imaging equipment that cost six figures. A lender can value it, a buyer can insure it, a bank will lend against it. A consulting firm has laptops.
This is why the trades sit so high on the list. A specialty contractor owns a truck and some tools with modest resale value. The thing that actually makes the money is knowing how to price a job, and that lives in one person's head — usually without them knowing they know it.
A license that is not personally yours
Some permissions transfer with the business. Some walk out with the owner.
A liquor license attaches to a location. A gas station permit attaches to a site. A restaurant's health permit attaches to the kitchen. Those convey. A law license attaches to a lawyer, a medical license to a doctor, a CPA license to an accountant. Those do not.
Legal services at 9.0. This is most of the reason.
The practical version for buyers: in a licensed trade, ask early whose name is on the license and what happens to it at closing. Sometimes a qualifying employee can hold it. Sometimes there is a grace period. Sometimes there is nothing, and the business cannot legally operate the day after you buy it.
Customers who are not personally yours
A relationship in your phone is not an asset. A contract with your company is.
This is the biggest factor and the hardest to fix. Most small business owners are the relationship: customers call their mobile, vendors ask for them by name, the crew works for them rather than for the company.
Sell that and the buyer receives a truck, a receivables balance, and a customer list that has already started calling somebody else.
The test is simple and uncomfortable. If the owner disappeared for ninety days with no warning, what percentage of revenue is still there in month four?
Four factors: a place customers travel to, physical assets a lender can value, a license attached to the site rather than the person, and customers contracted to the company rather than known personally to the owner. Businesses with three or four sell. Businesses with none close. The features that make a business feel meaningful to run — irreplaceability, personal loyalty, work only you can do — are the same features that make it unsellable.
Why do dentists sell when physicians don't?
Two lines sit near each other in the health care section and land at opposite ends of it.
Offices of dentists: 0.8 closures per sale. Offices of physicians: 3.0.
Both are doctors. Both completed four years of graduate training and a licensing process. Both see patients by appointment, bill insurance and employ clinical staff, often in the same medical park. Nearly every input matches. The outcomes are inverted.
Run the four tests.
A dental practice has a place, and patients come to it. It has equipment worth real money. It has a hygiene schedule generating revenue whether or not the dentist is in the room. Patients return every six months for work that is largely standardized. Call it three and a half out of four.
A physician's practice, especially a small one, is increasingly the physician. Referrals come from named colleagues who trust that specific doctor. Patients follow the doctor. The equipment is modest. One out of four, on a good day.
Same degree. One built an asset. The other built a very good job.
What does the exception look like?
Every category has businesses that beat it. A specialty trade contractor sits at 5.4 — that is the base rate, not a verdict on the one in front of you.
The crew has a foreman. Somebody other than the owner assigns work in the morning.
Customers are on paper. The contract names the company, not the owner.
Pricing is a process. There is a sheet, a formula, a system. A new estimator learns it in a month.
The phone number belongs to the business. Not to a person.
A contractor with all four is not a 5.4 business. It is closer to a dental practice and should be priced like one.
This is the actual thing being bought. Not the revenue — revenue is what the business did last year with the owner still in it. Separability is what it does next year without them.
It cuts the other way too. A restaurant where the chef is the draw and the lease has fourteen months remaining is not a 1.8 business. The category is a starting point, not an answer.
Does this change the silver tsunami story?
It sharpens it rather than reversing it.
2,336,751 American business owners are 55 or older — 52.6% of all owners, with the share running from 40.2% in Utah to 60.9% in New Mexico and West Virginia. Every succession-wave article of the last decade rests on that number and on an unstated assumption: that these businesses are coming to market.
The June analysis argued they largely would not, using the Exit Planning Institute's sell-through estimate and Japanese succession data. This file reaches the same conclusion from federal primary data, which is a useful independent confirmation.
What it adds is specificity. The businesses that fail to arrive are not a random sample. They are concentrated in the categories with the worst ratios — the trades and the personal service professions, which is most of what people picture when they picture a Main Street business.
The transition is real. The transactable portion is smaller than the demographic headline implies, and it skews hard toward businesses with hard assets.
No, but it makes it actionable. 2,336,751 owners are 55 or older, and the June analysis already argued most of that supply will not transfer. What the Census file adds is which supply: the shortfall is concentrated in owner-dependent trades and professional services rather than spread evenly. A searcher screening by industry is implicitly screening by transferability, whether or not they know it.
Four common misconceptions
Profitable businesses sell. Not reliably. A law firm out-earns most motels; the motel sells and the law firm closes. Profit is not the thing a buyer takes delivery of.
The retirement wave means a wave of businesses for sale. The wave is real. The inventory is smaller than the wave, and it is skewed toward the categories with hard assets.
Being irreplaceable is a strength. It is a compliment and a liability at once. Ask an owner what makes their business special and most will describe something that cannot be transferred. They are not wrong about the business. They are wrong about what it is worth to somebody else.
A broker will figure it out. In the high-ratio categories most sellers have never watched a comparable business change hands, because their competitors retired by turning the sign around. The price expectation comes from a podcast or a rule of thumb rather than from anything observed.
What does this mean for buyers and sellers?
For buyers, treat the category ratio as a base rate rather than a verdict. If a target sits in a high-ratio industry, the seller has probably never watched a comparable business change hands — their competitors retired by turning the sign around. Their price expectation is anchored to a podcast or a rule of thumb rather than to anything observed, and their capacity to help transfer relationships is untested because nobody in their world has attempted it.
That is not a reason to walk away. It is a reason to structure around the actual risk, which is that the value is currently ambulatory. In those categories a meaningful earnout is not an aggressive tactic; it is the only intellectually honest way to buy something whose earning power is presently walking around inside a person. A seller who genuinely believes the business transfers should have limited objection to being paid for being right.
One diligence question falls straight out of this table: ask the seller to name the last three businesses in their industry and region that sold, and to whom. In a high-ratio category most cannot answer. That silence is information.
Related: the lending side of the same risk in Are SBA loan defaults rising?, and the front-door half of the story in record business formation.
For sellers, if your industry sits near the top of the list you have a five to ten year project, and it is not growth. It is making yourself unnecessary.
Every customer relationship moved from a personal mobile to a named employee raises the sale probability. Every handshake converted into a written agreement where the counterparty is the company raises it. Every pricing decision taken out of your head and put into a documented process raises it. Every license or certification a key employee obtains in their own name raises it.
None of this appears in trailing financials, and some of it temporarily reduces margin. That is exactly why so few owners do it, and exactly why the ones who do end up in the short column of this table.
The uncomfortable version: if the business cannot run for a month without you, you do not have a business to sell. You have a job that you also happen to own.
Does the finding survive being attacked?
A ranking like this has three obvious ways to be an artifact rather than a result. I ran each one before publishing.
Is it just measuring industry size? The worry is that small industries produce unstable ratios and happen to cluster at the extremes. They do not. Across the 99 distinct industries the rank correlation between an industry's total recorded exits and its closures-per-sale ratio is +0.12, which is close to nothing. The twenty largest industries in the file have a median ratio of 2.6; the smallest have 2.5. Size is not doing the work.
Does it survive a stricter cut? Raising the qualification bar to 1,000 or more recorded sales drops the industry count from 99 to 77 and leaves the ordering essentially intact. Legal services is still worst at 9.0. Traveler accommodation and dentists are still the only categories at or better than parity. Four of the five worst industries under the published threshold are still in the worst five under the stricter one. The result is not an artifact of where the line was drawn.
Does the ambiguous category change the answer? About 3% of respondents chose "Other" for their previous business, and its disposition is undefined. Treating every one of those answers as a sale pulls the national figure down to 1.4. Treating them all as closures pushes it to 3.7. The national number moves a lot under that assumption. The ordering between industries does not, because the ambiguity is distributed across all of them.
Does it hold when aggregated? Yes, as the sector table above shows. Construction rolls up to 5.8 and retail to 1.9. A finding that only exists at one level of aggregation is usually a cell-size problem. This one is visible at every level.
What this does not establish is causation. The four factors are a reading of why the ordering looks the way it does, consistent with the pattern and with how these businesses are financed, but this file cannot test them directly. It records what happened, not why.
The boundary cases are the real test
A theory is worth more where it nearly fails. Seven industries sit in the band between 0.6 and 1.4 closures per sale, close enough to parity that the ordering could plausibly flip:
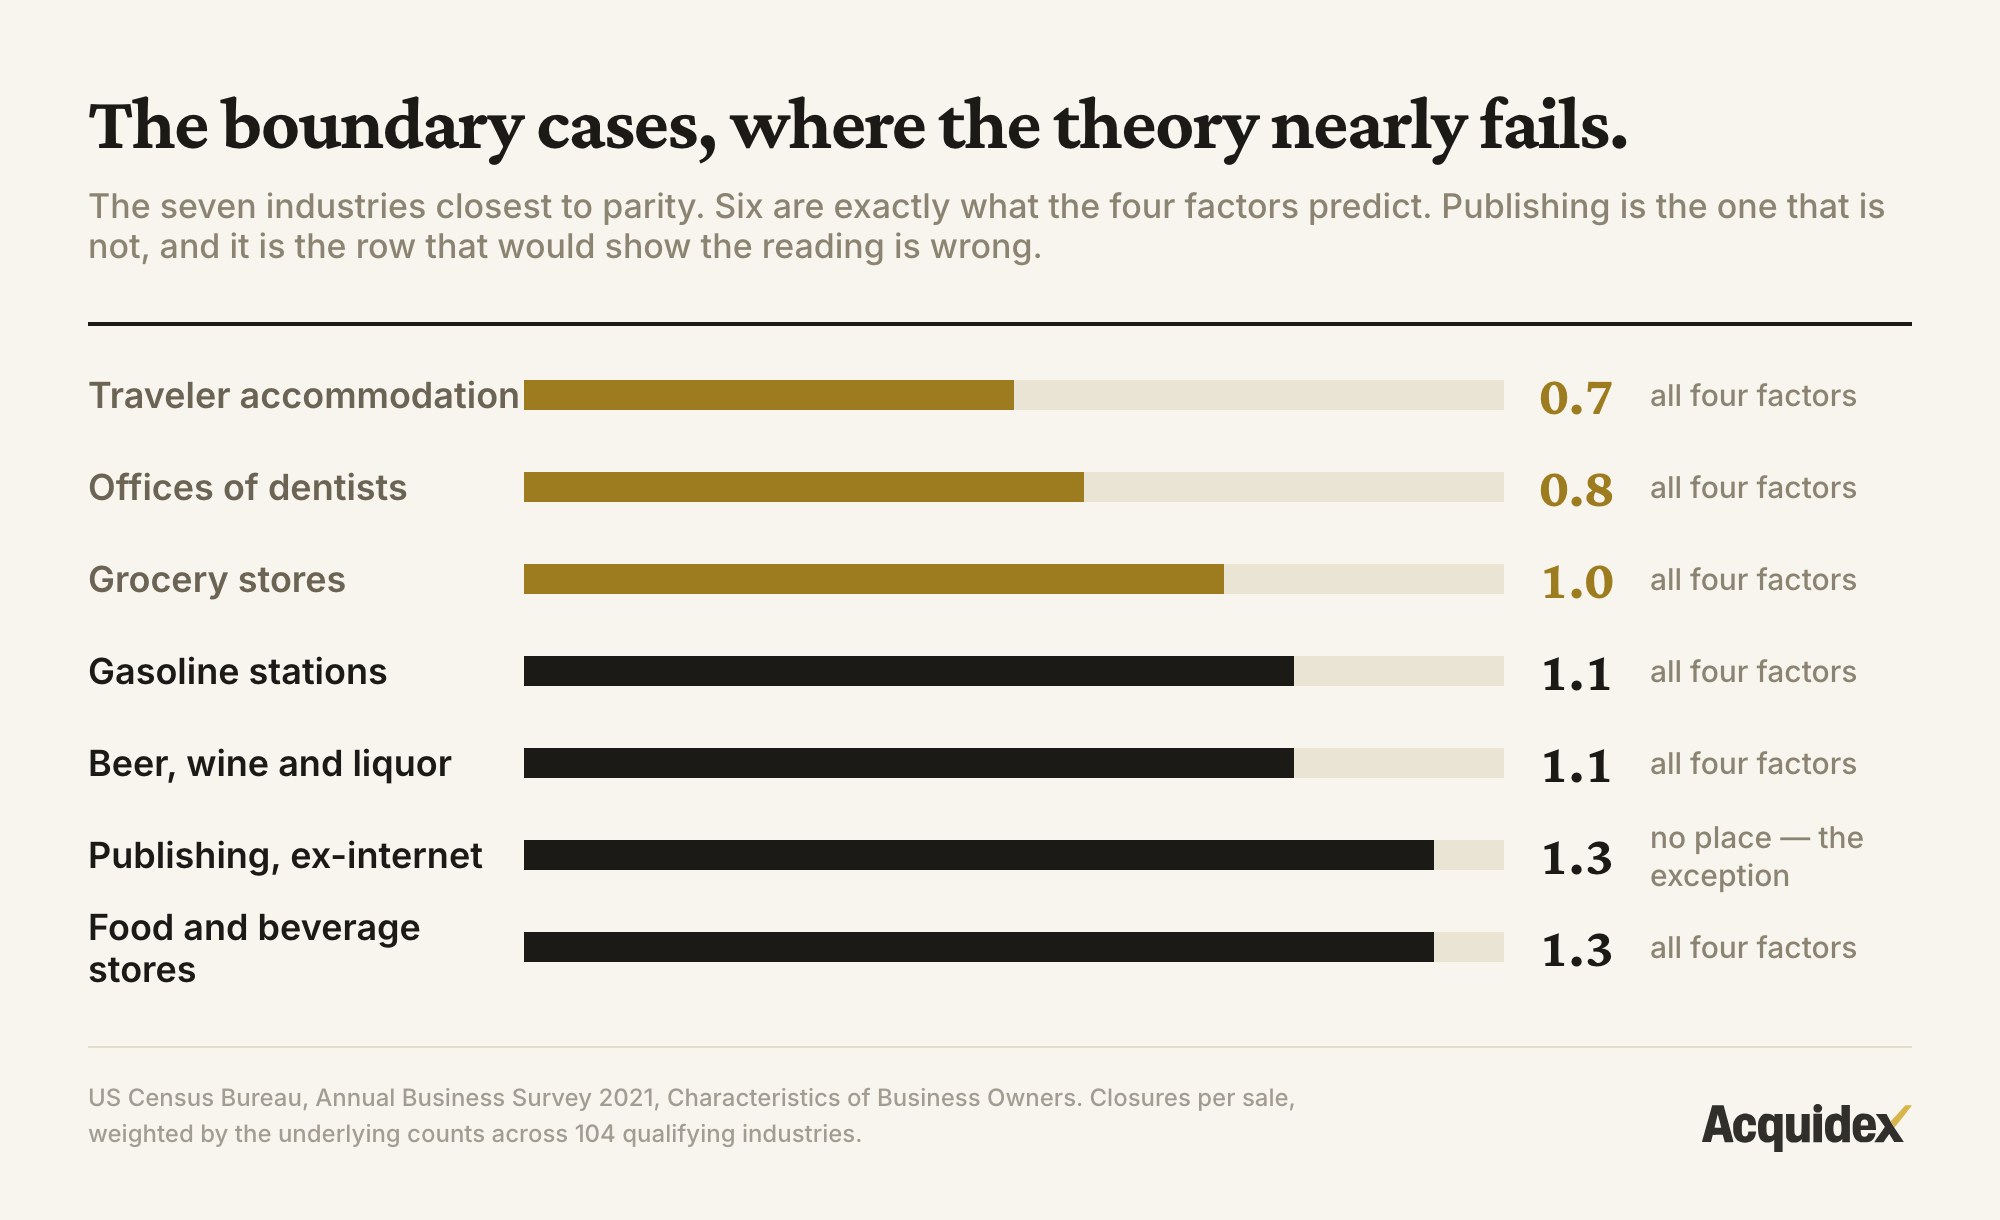
Six of the seven are exactly what the four factors predict: a fixed location customers travel to, inventory and equipment a lender can value, a licence or permit attached to the site, and customers who arrive out of habit rather than loyalty to a person.
Publishing is the one that does not fit the pattern, and it is worth saying so rather than quietly leaving it out of the chart. A publisher has no address customers visit. What it does have is the fourth factor in unusually pure form: titles, backlists and contracts that belong to the company rather than to the founder. If the four-factor reading is right, that alone should be enough, and here it appears to be. If the reading is wrong, this is the row that shows it first.
The concentration is worth one line as well. The 25 industries in the worst quartile account for 35% of all recorded closures but only 19% of all recorded sales. The failure to transfer is not spread evenly across the economy; it is bunched in a quarter of it.
Where I could be wrong
The sample is selected, and it matters. Everyone answering this survey is a current business owner. It counts the person who closed and started again, and the person who sold and started again. It misses everyone who exited and stayed out. The owner who sold a profitable HVAC company at sixty-one and retired is close to the archetypal good exit, and appears nowhere in this file. Neither does the owner who closed a failing restaurant and went back to salaried work. Both groups are large and they do not obviously cancel. If anything the bias runs toward closure, because starting over is a more common sequel to failure than to a life-changing cheque.
So the national ratio describes serial owners. It is an upper bound on the closure share rather than an estimate of it.
What survives is the comparison. The same filter applies to lawyers and to dentists. The retiree who sold and vanished is missing from both columns, so the gap between industries holds even where the level is soft.
It is a stock, not a rate. The lookback is unbounded. A respondent's previous business may have ended in 2019 or in 1987. Nothing here supports any claim about annual closure rates.
Disposition is self-reported. An owner describes what happened to a business they no longer hold. Some asset sales may be reported as closures, and some wind-downs with a small asset transfer as sales. There is no way to audit that inside the file.
One survey year. 2021 only. Industries sitting next to each other in the middle of the table should be read as indicative. The extremes are far enough apart to survive reasonable instability.
State figures are confounded by industry mix. A state heavy in construction posts a high ratio for that reason alone, and I have not decomposed it. I would not build anything on the state numbers.
What would make this stronger. Replication across 2019, 2020, 2022 and 2023. Decomposition of the state variation. A cross against owner age within industry, to test whether the transferable industries are also the ones where older owners hold on longest.
The full ranking
Every qualifying industry, ranked. 104 industry codes qualify at 400 or more recorded sales and 2,500 or more total recorded exits; the Census file reports at mixed NAICS levels, so five of those are parent codes that repeat a child's exact figures and are dropped here, leaving 99 distinct rows. Bold marks the extremes: 7.0 and above, and parity or better.
| # | Industry | NAICS | Closed | Sold | Closures per sale |
|---|---|---|---|---|---|
| 1 | Legal services | 5411 | 18,929 | 2,095 | 9.0 |
| 2 | Residential building construction | 2361 | 15,998 | 2,090 | 7.7 |
| 3 | General freight trucking | 4841 | 4,441 | 584 | 7.6 |
| 4 | Foundation, structure, and building exterior contractors | 2381 | 7,042 | 1,009 | 7.0 |
| 5 | Construction of buildings | 236 | 20,214 | 2,910 | 7.0 |
| 6 | Other schools and instruction | 6116 | 2,865 | 415 | 6.9 |
| 7 | Truck transportation | 484 | 7,204 | 1,171 | 6.2 |
| 8 | Building finishing contractors | 2383 | 7,224 | 1,254 | 5.8 |
| 9 | Construction | 23 | 53,960 | 9,400 | 5.7 |
| 10 | Specialty trade contractors | 238 | 31,509 | 5,831 | 5.4 |
| 11 | Other specialty trade contractors | 2389 | 4,841 | 906 | 5.3 |
| 12 | Specialized design services | 5414 | 3,552 | 667 | 5.3 |
| 13 | Nonresidential building construction | 2362 | 4,215 | 821 | 5.1 |
| 14 | Building equipment contractors | 2382 | 12,401 | 2,661 | 4.7 |
| 15 | Specialized freight trucking | 4842 | 2,723 | 589 | 4.6 |
| 16 | Performing arts, spectator sports, and related industries | 711 | 2,762 | 605 | 4.6 |
| 17 | Offices of real estate agents and brokers | 5312 | 9,672 | 2,155 | 4.5 |
| 18 | Educational services | 611 | 4,977 | 1,124 | 4.4 |
| 19 | Transportation and warehousing | 48-49 | 11,768 | 2,745 | 4.3 |
| 20 | Architectural, engineering, and related services | 5413 | 9,142 | 2,402 | 3.8 |
| 21 | Electronic shopping and mail-order houses | 4541 | 4,442 | 1,224 | 3.6 |
| 22 | Activities related to real estate | 5313 | 6,551 | 1,810 | 3.6 |
| 23 | Professional, scientific, and technical services | 541 | 79,352 | 21,937 | 3.6 |
| 24 | Wholesale electronic markets and agents and brokers | 4251 | 2,343 | 669 | 3.5 |
| 25 | Nursing and residential care facilities | 623 | 2,096 | 603 | 3.5 |
| 26 | Computer systems design and related services | 5415 | 13,947 | 4,044 | 3.5 |
| 27 | Services to buildings and dwellings | 5617 | 11,845 | 3,462 | 3.4 |
| 28 | Heavy and civil engineering construction | 237 | 2,239 | 663 | 3.4 |
| 29 | Offices of other health practitioners | 6213 | 8,640 | 2,580 | 3.4 |
| 30 | Clothing and clothing accessories stores | 448 | 2,938 | 905 | 3.2 |
| 31 | Child day care services | 6244 | 2,937 | 926 | 3.2 |
| 32 | Employment services | 5613 | 2,263 | 717 | 3.2 |
| 33 | Other personal services | 8129 | 2,971 | 957 | 3.1 |
| 34 | Other miscellaneous store retailers | 4539 | 3,088 | 1,004 | 3.1 |
| 35 | Offices of physicians | 6211 | 6,796 | 2,240 | 3.0 |
| 36 | Miscellaneous durable goods merchant wholesalers | 4239 | 1,994 | 663 | 3.0 |
| 37 | Miscellaneous store retailers | 453 | 5,982 | 1,991 | 3.0 |
| 38 | Accounting, tax preparation, bookkeeping, and payroll services | 5412 | 9,788 | 3,265 | 3.0 |
| 39 | Advertising, public relations, and related services | 5418 | 2,853 | 953 | 3.0 |
| 40 | Administrative and support services | 561 | 21,284 | 7,200 | 3.0 |
| 41 | Social assistance | 624 | 5,003 | 1,704 | 2.9 |
| 42 | Repair and maintenance | 811 | 11,556 | 3,971 | 2.9 |
| 43 | Administrative and support and waste management and remediation services | 56 | 22,661 | 8,128 | 2.8 |
| 44 | Real estate | 531 | 23,170 | 8,343 | 2.8 |
| 45 | Real estate and rental and leasing | 53 | 25,037 | 9,042 | 2.8 |
| 46 | Support activities for transportation | 488 | 1,979 | 715 | 2.8 |
| 47 | Management, scientific, and technical consulting services | 5416 | 16,098 | 5,962 | 2.7 |
| 48 | Nonstore retailers | 454 | 6,525 | 2,469 | 2.6 |
| 49 | Other financial investment activities | 5239 | 4,443 | 1,685 | 2.6 |
| 50 | Information | 51 | 7,481 | 2,858 | 2.6 |
| 51 | Merchant wholesalers, durable goods | 423 | 11,156 | 4,303 | 2.6 |
| 52 | Securities, commodity contracts, and other financial investments and related activities | 523 | 4,877 | 1,882 | 2.6 |
| 53 | Wholesale trade | 42 | 19,614 | 7,569 | 2.6 |
| 54 | Individual and family services | 6241 | 1,912 | 749 | 2.5 |
| 55 | Machinery, equipment, and supplies merchant wholesalers | 4238 | 2,554 | 1,005 | 2.5 |
| 56 | Office administrative services | 5611 | 2,238 | 887 | 2.5 |
| 57 | Automotive repair and maintenance | 8111 | 7,655 | 3,083 | 2.5 |
| 58 | Finance and insurance | 52 | 15,968 | 6,787 | 2.4 |
| 59 | Merchant wholesalers, nondurable goods | 424 | 6,156 | 2,619 | 2.4 |
| 60 | Building material and garden equipment and supplies dealers | 444 | 3,166 | 1,358 | 2.3 |
| 61 | Insurance carriers and related activities | 524 | 8,675 | 3,804 | 2.3 |
| 62 | Health care and social assistance | 62 | 29,694 | 13,103 | 2.3 |
| 63 | Agencies, brokerages, and other insurance related activities | 5242 | 8,533 | 3,774 | 2.3 |
| 64 | Drinking places (alcoholic beverages) | 7224 | 1,971 | 875 | 2.2 |
| 65 | Arts, entertainment, and recreation | 71 | 6,194 | 2,779 | 2.2 |
| 66 | Credit intermediation and related activities | 522 | 2,458 | 1,107 | 2.2 |
| 67 | Other services (except public administration) | 81 | 21,483 | 9,735 | 2.2 |
| 68 | Food manufacturing | 311 | 1,813 | 837 | 2.2 |
| 69 | Fabricated metal product manufacturing | 332 | 3,475 | 1,633 | 2.1 |
| 70 | Ambulatory health care services | 621 | 22,570 | 10,794 | 2.1 |
| 71 | Other professional, scientific, and technical services | 5419 | 3,976 | 1,931 | 2.1 |
| 72 | Building material and supplies dealers | 4441 | 2,353 | 1,143 | 2.1 |
| 73 | Sporting goods, hobby, musical instrument, and book stores | 451 | 2,848 | 1,406 | 2.0 |
| 74 | Manufacturing | 31-33 | 17,874 | 8,896 | 2.0 |
| 75 | Furniture and home furnishings stores | 442 | 2,167 | 1,079 | 2.0 |
| 76 | Retail trade | 44-45 | 39,961 | 20,237 | 2.0 |
| 77 | Sporting goods, hobby, and musical instrument stores | 4511 | 2,601 | 1,377 | 1.9 |
| 78 | Motor vehicle and parts dealers | 441 | 4,505 | 2,424 | 1.9 |
| 79 | Food services and drinking places | 722 | 26,852 | 14,665 | 1.8 |
| 80 | Restaurants and other eating places | 7225 | 23,787 | 13,343 | 1.8 |
| 81 | Miscellaneous manufacturing | 339 | 1,706 | 961 | 1.8 |
| 82 | Personal and laundry services | 812 | 9,926 | 5,763 | 1.7 |
| 83 | Direct selling establishments | 4543 | 1,965 | 1,177 | 1.7 |
| 84 | Health and personal care stores | 4461 | 2,613 | 1,589 | 1.6 |
| 85 | Automobile dealers | 4411 | 1,861 | 1,141 | 1.6 |
| 86 | Accommodation and food services | 72 | 29,553 | 18,637 | 1.6 |
| 87 | Lessors of real estate | 5311 | 6,948 | 4,384 | 1.6 |
| 88 | Personal care services | 8121 | 4,634 | 3,081 | 1.5 |
| 89 | Amusement, gambling, and recreation industries | 713 | 3,242 | 2,177 | 1.5 |
| 90 | Drycleaning and laundry services | 8123 | 1,908 | 1,286 | 1.5 |
| 91 | Other amusement and recreation industries | 7139 | 2,957 | 2,055 | 1.4 |
| 92 | Publishing industries (except internet) | 511 | 1,773 | 1,333 | 1.3 |
| 93 | Food and beverage stores | 445 | 5,717 | 4,305 | 1.3 |
| 94 | Beer, wine, and liquor stores | 4453 | 1,607 | 1,439 | 1.1 |
| 95 | Gasoline stations | 4471 | 2,117 | 2,004 | 1.1 |
| 96 | Grocery stores | 4451 | 2,335 | 2,244 | 1.0 |
| 97 | Offices of dentists | 6212 | 3,710 | 4,641 | 0.8 |
| 98 | Traveler accommodation | 7211 | 2,296 | 3,355 | 0.7 |
| 99 | Accommodation | 721 | 2,700 | 3,971 | 0.7 |
Sources
US Census Bureau, Annual Business Survey 2021, Characteristics of Business Owners. Recomputed from the published file on 9 August 2026.
The survey samples current business owners, so the comparison between industries is the finding here, not the national level.
One last row, since leaving it out would be cowardly. Accounting and tax preparation sits at 3.0 closures per sale. I am a CPA, and my own profession is on the wrong half of this table.
The dentist and the lawyer both went to graduate school. Only one of them built something somebody else can own.

Avery Hastings, CPA
Founder, Acquidex • CPA • Tokyo, Japan
Avery Hastings is a CPA based in Tokyo, Japan and the founder of Acquidex. She focuses on helping buyers evaluate small-business deals with clear cash-flow logic, realistic downside analysis, and practical diligence frameworks.
Keep up with Avery →Sources
No external sources are cited in this article.
Keep Reading
- Do Overconfident Buyers Pay More for Small Businesses?18 min read read
A landmark study on Forbes 500 CEOs shows overconfident executives have 65% higher odds of making an acquisition, and the market reacts 90 basis points more negatively to their deals. The mechanism transfers to private-market buyers. The measurement does not. Here is what a buyer-side test would actually look like.
- The Silver Tsunami Is Real. Most of Its Supply Won't Transfer.10 min read read
A flood of retiring owners is not a flood of buyable deals. Across the U.S. and Japan, the data shows most of the supply behind the 'generational opportunity' will close rather than change hands.
- The Formation Boom Is Real. The Pipeline Inside It Is Shrinking.13 min read
Business applications just hit a June record — but the share that becomes an employer business you can actually buy has fallen to the lowest level on record, and it's rotating hard by sector.
- Why Does Walking Away Get Harder After the LOI?13 min read read
A deal's structure adds commitment on a schedule while diligence is supposed to keep the decision open. What fifty years of research says about that tension, new evidence from actual acquisitions, and where the evidence stops.